Zerebro
 Bitcoin
 Quantus
 Pearl
Pearl Starknet
 ZKsync
 NEAR Protocol

XRP price remained within a critical support zone as various analysts projected optimistic continuation tendencies that indicated an increase in price levels. Regardless of the short-term merge, chart set-ups indicated that the token might be on the verge of an upsurge period, with forecasts bound to the $5 level in case momentum gains strength.
Bull Flag Formation Positions XRP Price for $4–$6 Rally
Analyst Steph Is Crypto noted on the 3-day chart that XRP clearly showed a bull flag, which is a typical continuation pattern in technical analysis. This formation was after a drastic upward rally in 2025, where it displayed an upward surge that turned to a downward consolidation channel within $2.4 and $3.00. The correction period implied accumulation, instead of distribution, and preserved the overall bullish momentum.
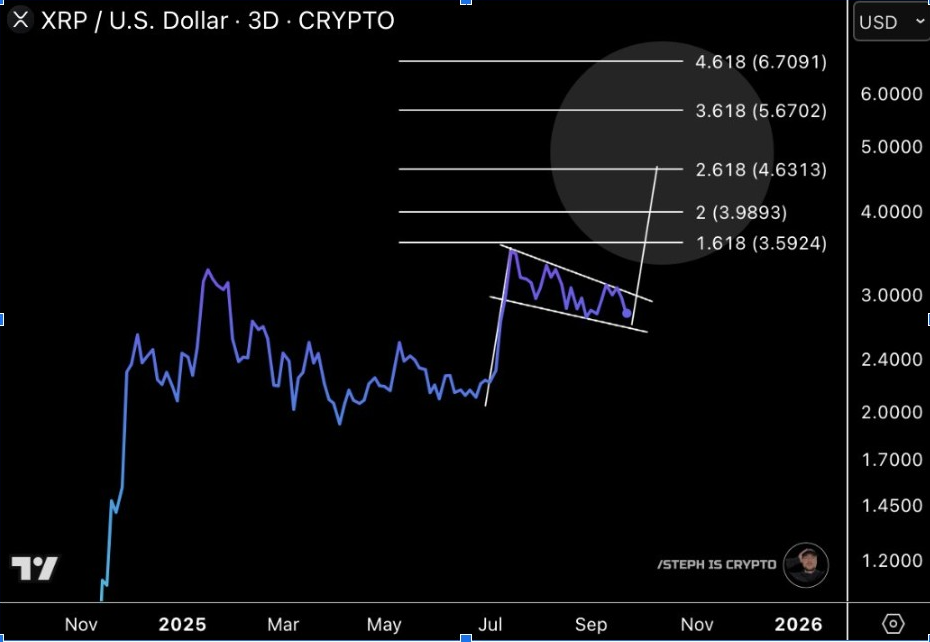
Also, the discussion provided possible Fibonacci extension levels after the breakout. The first major upside target of the 1.618 extension was at $3.59, followed by $3.98 and $4.63. Further, higher extensions indicated distant long-term targets at $5.67 and $6.70, strengthening the possibility of additional profits if XRP proves it can continue bullish.
The consolidation within the bull flag was also considered a cooling-off phase, where short-term profit-takers took advantage of it, but long-term holders hoarded. The structure was built on the bottom line around $2.40, which was a strong support. More so, a retreat of this zone threatened to shake the position, but as long as it held, prospects encouraged a rally continuation in the direction of the $4.00 to $6.00 territory.
Ripple Holds $2.80 Support Amid Breakout Hints
Analyst Dark Defender offered a wider perspective of the day-to-day analysis that focused on XRP testing its support level of $2.80 more than once and faced rejection at $3.13. The level had been an important demand area for several months. This general pattern was in line with a falling wedge formation, a positive reversal pattern that, in the past, turned out to the upside.
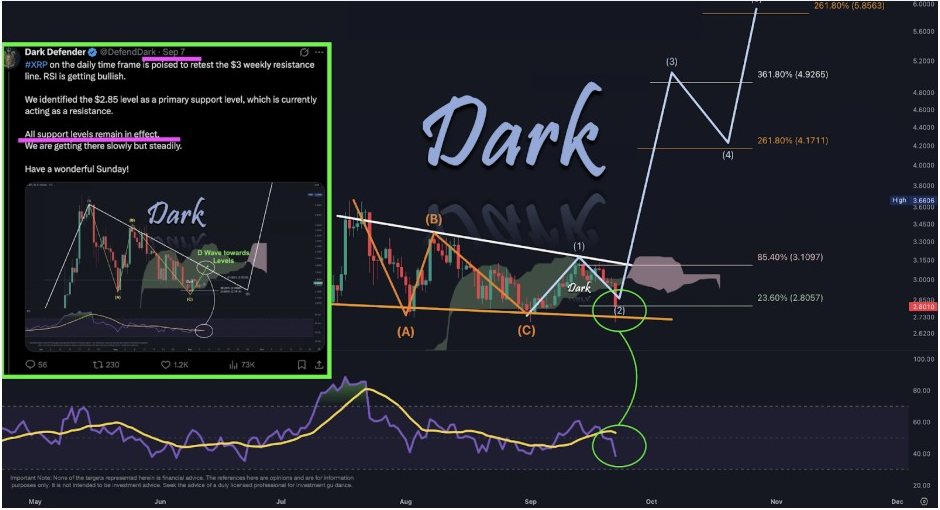
The other point of focus was momentum signals on the daily RSI. The indicator was moving downward in the oversold direction, indicating short-term weakness. Although the history of such arrangements had in the past coincided with deep accumulation zones, sometimes before sharp rallies.
The alignment of a falling wedge with an oncoming oversold RSI strengthened the likely occurrence of an up-breakout instead of a lengthy down-fall. Analysts predicted targets at $4.17 and $4.92; a breakout could spike to $5.85. On the negative side, immediate support was at $2.80 and further at $2.64.
Consequently, the analyst highlighted that despite the market hesitating, October might be a catalyst month for XRP. This is in line with the behavior of falling wedge breakouts over the years.
Buyers Defend Key Support as XRP Retests $2.50–$2.90 Zone
Analyst STEPH is CRYPTO, and in another analysis, it was indicated that XRP price retested its most critical 3-day support zone, which lies along the range of $2.50 and $2.90. This zone often served as resistance and support, while being the central price in recent history.
In addition, recent retrenchment into this zone was brought out as a possible reaffirmation of demand before a renewed increase.
In early 2025, XRP surged past $3.50 before reversing to the support zone. Rebounds were regular around this range, implying that buyers defended the level. If support is sustained, the Ripple token could rally to $5.00.
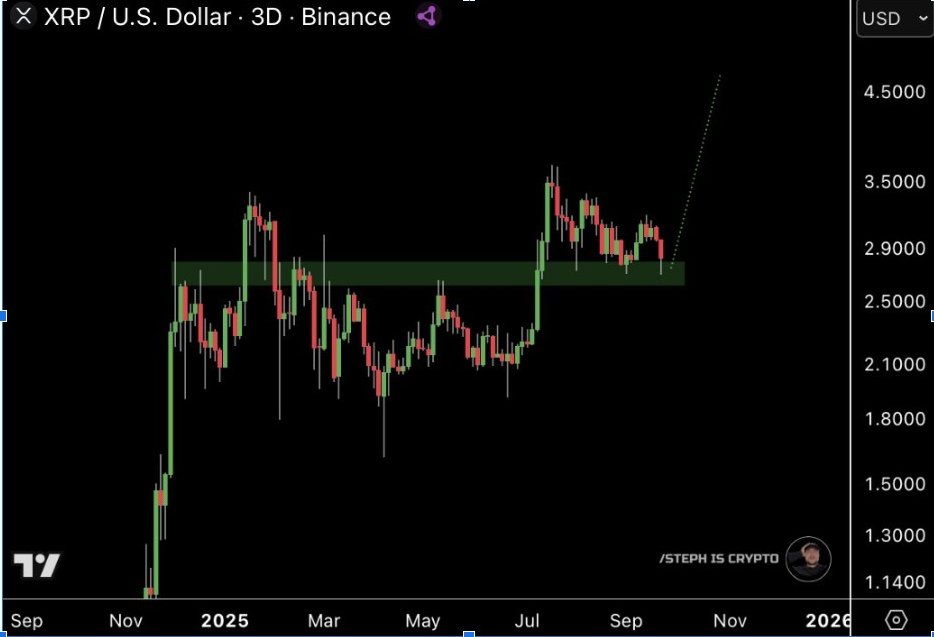
XRPUSD 3-D Chart, Source: X
However, loss of this support range would drag down the structure and make XRP revert to previous consolidation zones around $2.10. Although the $2.50-$2.90 band was not broken, the formation remained constructive, while not altering the higher-low structure of the greater uptrend, but allowed further progression to higher resistance levels.
At the time of writing, XRP was approximately $2.94, still within the critical range of support analysts had mentioned as the determinant of its further action.