Celestia
 Pearl
Pearl Quantus
 Zcash
Zcash Hyperliquid
 Aerodrome Finance
 NEAR Protocol
Sei price patterns and on-chain data show rough waters ahead, with liquidity indicators losing their strength. Data indicates that the token has been trading around important technical points, with the Total Value Locked (TVL) declining.
Sei Price Facing Bearish Action
Looking at three-day Sei price charts, the token was trading at $0.31234 before rising to a high of $0.31465. It then declined to a low of $0.27861 to end the period at $0.29435. This represents a loss of 5.77% in value over three days.
A downward trend line spans several months, embracing a succession of several low highs. This characterizes the overall downward trend. The high of $1.14465 and the low of $0.10339 plot the current Fibonacci retracement levels.
Sei price is slightly lower, closing at $0.29435 below the $0.786 retracement and the long-term descending resistance. The candlestick in the circled area of the chart identifies repetitive interaction with the area of $0.35. This indicates volatility with the sellers still active.
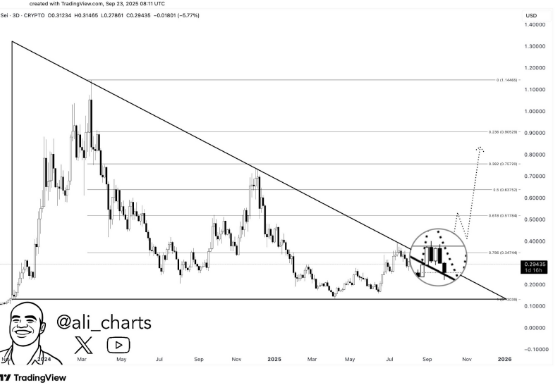
This indicates a small trading range over the short term relative to the larger movements witnessed over the multi-day chart. Analyst Ali Martinez suggests bullish momentum could return soon.
A close near the $0.35 level is key for a bullish retest. This insight may also influence sentiment around the Sei price.
Chart Structures and Technical Levels
The recent Sei price candle opened at $0.2928. It reached a high of $0.2937 and dipped to a low of $0.2918. The candle closed slightly higher at $0.2932. This movement reflects modest upward momentum.
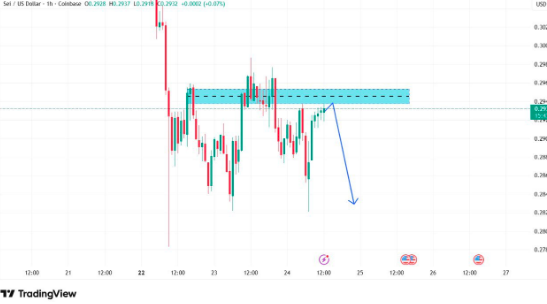
The chart shows a marked resistance zone at $0.2940.296. Several candles with long upper wicks highlight repetitive rejection by this tight band. Should the Sei price fail to break above the resistance, we could see a dip down to previous support levels.
Sei TVL Drops, Metrics Signals Weakening Market
In addition to the charts, the TVL stood at $524.73 Million when writing, a daily decrease of 0.83%. Although humble, this retracement was preceded by stronger growth earlier in the year, as DeFiLlama data shows. There was an impressive uptrend till mid-2025 before a gradual cooling off.
The previous day, DEX trading volume was 32.55 million, whereas the perpetual futures volume was only $9,212. This indicates a dissimilarity between the spot and derivatives market trading volume.
The comparable app revenue amounted to $29,945 in the identical period, and app fees made $110,410. This proves that the on-chain applications are still used despite the overall pullback.
Chain-level data shows fees ot $668 over a 24-hour period, which are reflected in an equal amount of revenue. This indicates a balance in this activity sample. The period inflows have been registered at $130.67, which slightly affected the total liquidity changes.
Currently, indicators show that the Sei price is steady yet wary. The following sessions might stabilize the Sei price with the price and liquidity close to the support zones. Otherwise, another retreat into the lower areas should the support zones fail to hold.