NEAR Protocol
 Bitcoin
 Puffer
 Hyperliquid
 ZKsync
 Pudgy Penguins
 Pearl
Pearl

The Sei price has recovered from a critical support area after momentarily testing the lows at $0.27. The token has increased to $0.28 due to the bull action.
SEI price charts indicate that it has reached the bottom of its trading channel, a range it has repeatedly tested since early September. The following technical target is approximately at the level of $0.34, with intra-resistance levels found at $0.31 and $ 0.33. The Sei price action indicates a strong effort to regain its principality, as long as the existing support is well maintained.
Sei Prices on a Massive Spike
CoinMarketCap data indicates that the Sei price was at $0.2773 as of press time, a 3.19% jump in the past 24 hours.
12-hour SEI price charts show that the token has been bouncing within a wide horizontal band, with a support level at the lower end of the derivative at $0.27. Resistance levels on the upper end of the derivative extend to $0.35. The most recent candle depicts a clear rejection of the lower border, increasing the argument in favor of a short-term positive trend.
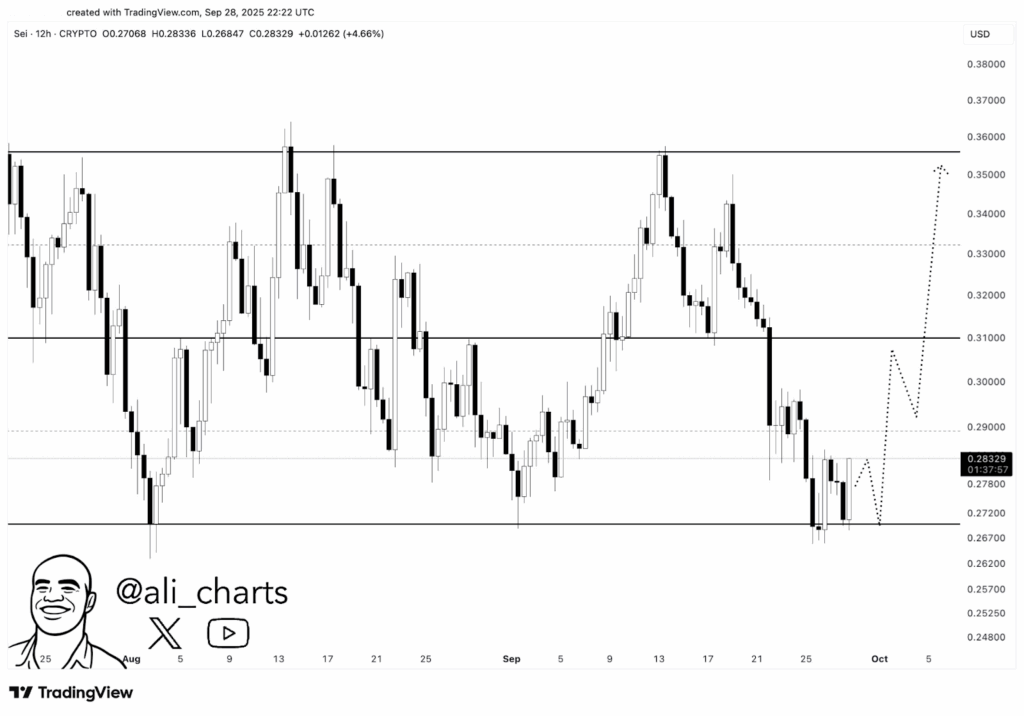
There are short-term dotted forecasts on the chart that point to the chart shifting to $0.31. This later saw it further rise to a long-term of $0.34-0.35. Maintaining this progress will, however, rely on the capability to retain more than $0.27, which has served as a buffer line since the end of August.
Some of the key resistance levels found throughout the charts are $0.29, which is acting as the short-term pivot. The $0.31 range acts as a mid-range resistance, and $0.34-35 as the top target. The levels correspond to the levels of the last congestion zones observed in late August and mid-September when price responses formed very solid horizontal barriers.
It would be very essential to make a trend reversal up to the higher targets by breaking and holding over $0.31. The support of $0.27 is preventing alteration of the market structure.
Sei Price Chart Show Sideways Breakout Attempt
Looking at 4-hour Sei price charts, we see that following the continuing decline that was trapped within a falling channel since the middle of September, SEI escaped into a fluctuation zone between $0.27 and $0.28.
The Money Flow Index (MFI) stands at 47.04, indicating that no overwhelming bulls and bears are controlling the current range. The Awesome Oscillator (AO) stands at around 0.0004, indicating a decline in bearish movement. There are chances of a change towards the positive territory where buyers maintain their dominance.
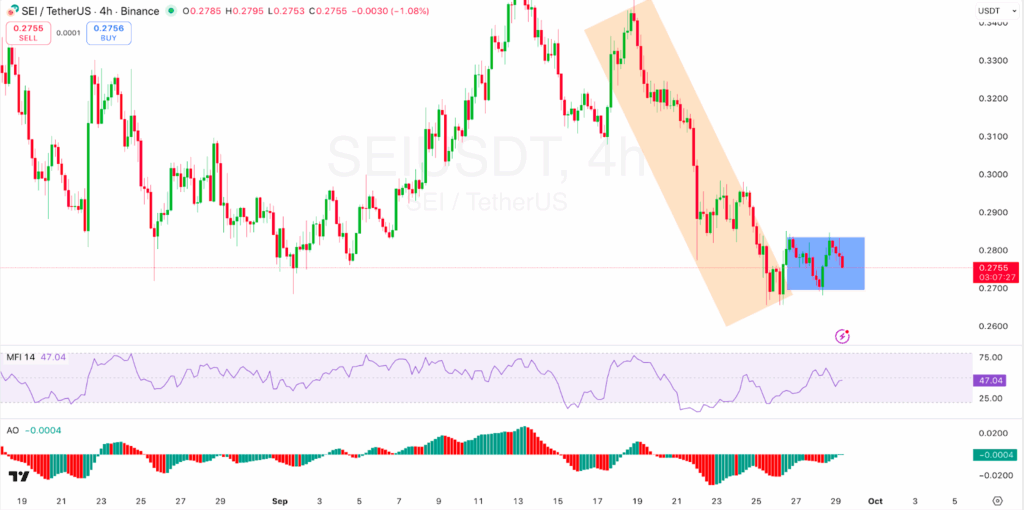
The escape of the shaded downward channel is an indication that the stage of heavy selling could have eased out. The chart illustrates consolidation, where market players are waiting to take the next disruptive step.
Technically, Sei is at a crossroad. Its recovery above the support at $0.27, along with the fact that its intraday volume has been good, indicates a more solid base than in past events. The coordination of the 12-hour bounce, 4-hour channel breakout, and neutral to improving momentum indicators create an optimistic tone on the market.
Nevertheless, the market should be able to sustain a buy-side pressure that will verify an upward trend. The near-term outlook of achieving the goals on SEI price lies through the short-term pattern of hitting the target of at least to $0.3 and more.