Dacity Coin
 NEAR Protocol
 Quantus
 Bitcoin
 Celestia
 Pearl
Pearl Pudgy Penguins
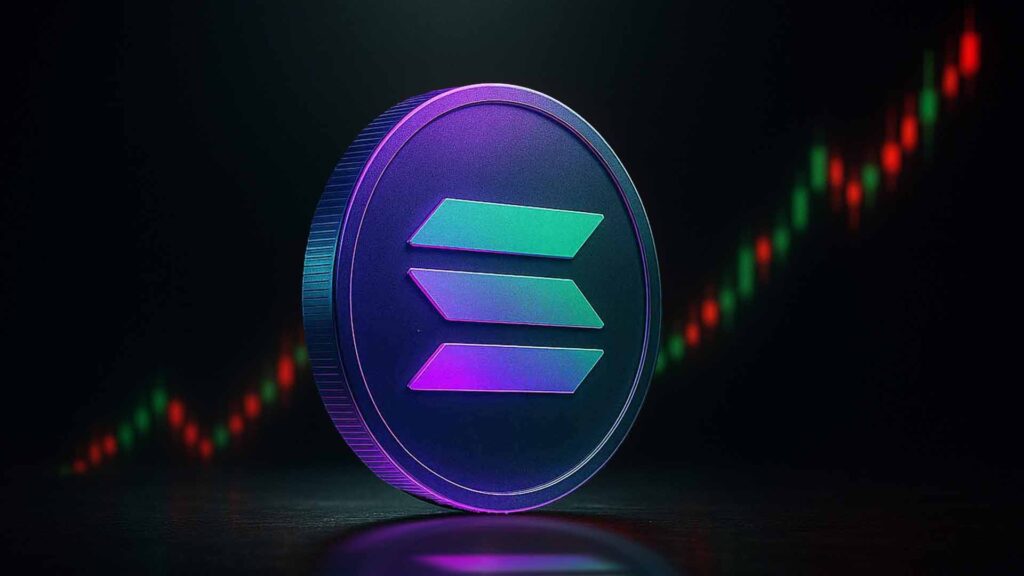
Solana price has been moving back upwards after another 24% pullback, in keeping with a pattern that has been repeating on its daily chart. The recent correction is reflected in the previous ones of the same scale, accompanied by fresh price growth.
The latest trend saw the SOL crypto regaining momentum fast after a late September drop, as the price fell at a high rate. It regained stability by re-entering high resistance areas. The Solana crypto traded close to $226. It gained 3.68% over 24 hours, according to CoinMarketCap data.
Technical Structure Highlights Pullback-and-Run Cycle on Solana Price
The daily candlestick chart reveals a clear pattern of pullbacks, with an average decline of 24.40% preceding the renewed run. This repetitive pattern suggests that buyers will consistently re-enter at lower levels, causing the price to rise in cycles.
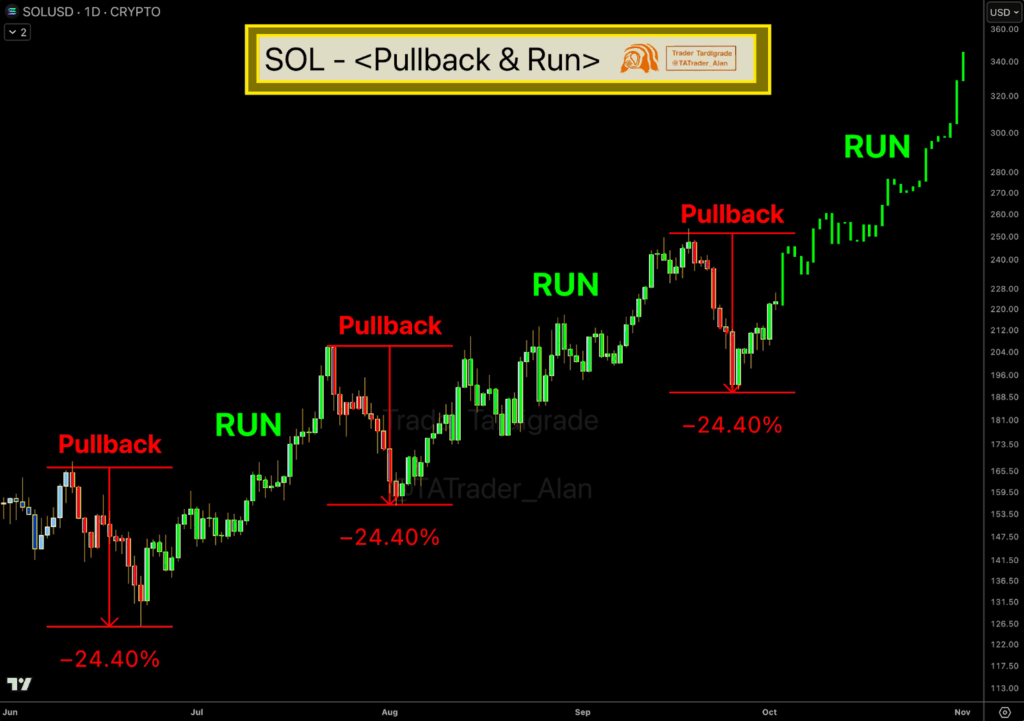
Following the recent correction, Solana has already surpassed the $220 level. It is now testing the resistance level of $230.
Solana Price is Moving in an Uptrend
Examining additional charts, we observe that the stochastic oscillator displays values of approximately 75.98 and 67.26, indicating a strong bullish trend. However, there is a high risk of the token turning overbought.
The 23.15 value of the Average Directional Index (ADX) indicates a trend direction that is increasing. It indicates that volatility is gradually increasing after a period of consolidation.
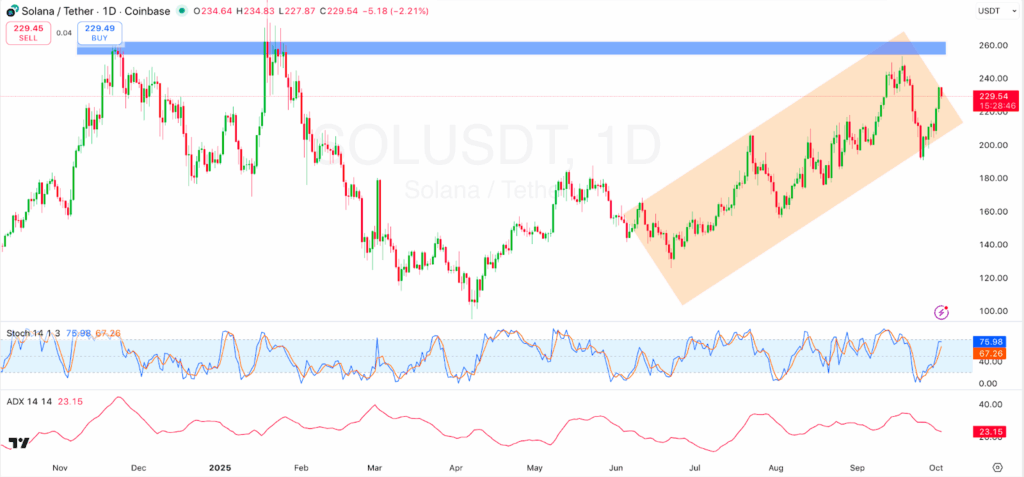
The trading chart indicates that the Solana price has been consistently increasing, with an intraday low of $217.32 and highs of over $226. The dynamic increasing trend supports the resurgence of demand, as traders are accumulating positions after achieving the pullback.
The charts revealed instant resistance around the $235-$240 levels, where price movements had not corrected in the past weeks. The breakout beyond that zone may open the door to the resistance band of $260.
On the negative side, now the range between 215 and 220 looks like a major support zone after the rebound.
Solana remains on an uptrend, which is still sustained by the medium-term ascending channel that has been evident since June. The general trend remains bullish as long as the price does not exceed this range.
If buyers maintain dominance at levels above $230, the market focus could shift towards achieving greater goals on the upper margins of the channel.
Solana Crypto News: TVL Levels Spike
According to DefiLlama data, Solana has increased its Total Value Locked (TVL) to $ 12.27 billion. It represents a 6.53% TVL growth over a 24-hour period.
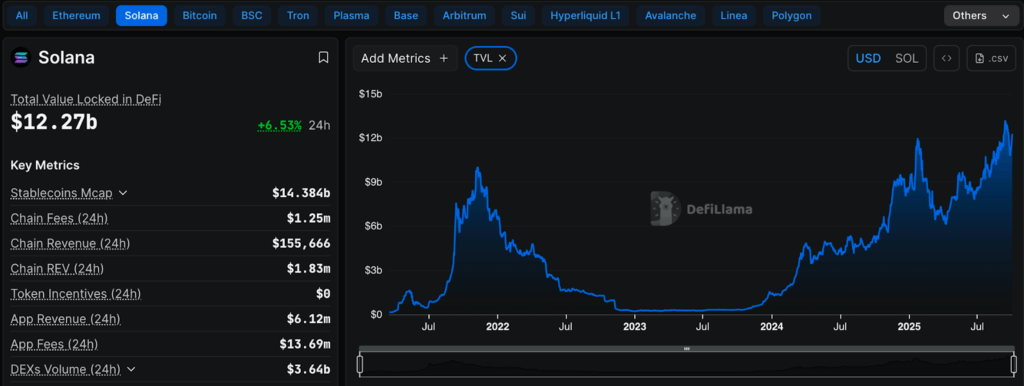
This growth represents rising capital flows into Solana-based decentralized applications. The recurrence of the 24% pullback and subsequent rallies highlights a technical rhythm defining the Solana price discovery. With the TVL having grown to over $12 billion, both price and on-chain data indicate steady inflows.
The pattern gives traders a guideline for anticipated retracements and rallies. Solana’s ability to recover after every correction suggests that it maintains demand in the long run.
Besides, the emphasis on the increased involvement of DeFi participants justifies Solana’s position as one of the most popular Layer 1 ecosystems.