astronaut
 Pearl
Pearl NEAR Protocol
 Starknet
 Zcash
Zcash Pudgy Penguins
 Ethena

Chainlink price is exhibiting tendencies of repeating earlier historic cycle patterns. This suggests a period of consolidation similar to that in 2020, preceding the parabolic breakout in the asset. LINK price increased by almost 3% in the last 24 hours, trading at around $22.36 as of press time.
Historical Parallels Suggest a Familiar Setup for Chainlink Price
Examining historical data reveals an apparent similarity. LINK price is at a late stage of its price discovery period. This is after a lengthy consolidation process similar to that of 2019-2020.
Chainlink price remained relatively stable during the initial phase. It later surged to new all-time highs, driven by increased participation from both institutions and retail investors.
Analysts note from the chart that the LINK price experienced a prolonged consolidation phase. Historically, this has often led to impulsive and decisive moves. This cyclical price fluctuation aligns with the recent price stabilisation, which has ranged between $20 and $23.
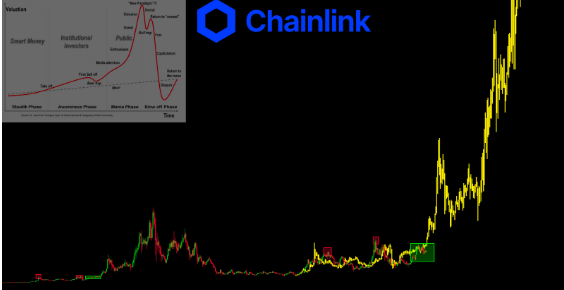
The fractal comparison shows that Chainlink has occurred multiple times on accumulation bases and then proceeded to higher valuation levels. Larger trading volumes and ecosystem growth typically accompany it.
This analysis of cyclical patterns has caught the attention of long-term investors. They see behavioral similarities in Chainlink price between the current and previous market cycles.
This consolidation was typical of past bull markets. It often began with a quiet “Stealth Phase.” That phase transitioned into the more visible Awareness phase. Eventually, a sharp rise in value followed as new participants entered the market.
Chainlink Network Fees Decline Sharply
Price action herds remain bullish on Chainlink. However, network statistics reveal a sharp drop in fees generated. This contrast raises questions about the sustainability of the current momentum.
According to data from Artemis, total fees paid to the Chainlink network have dropped sharply. In mid-July, users were paying around $70,000 in fees. That figure has since plunged by over 95%, reaching as low as $1,300.
Such a drop implies that the network is less active or that demand for transactions over the past few weeks is low. Traditionally, decreases in network fees have been associated with periods of low on-chain usage. Yet, they do not always reflect poor fundamentals.
During the 2020 pre-rally stage, Chainlink also exhibited muted network indicators. It was followed by an increase in usage and transaction volumes as DeFi protocols based on oracle data feeds gained traction.
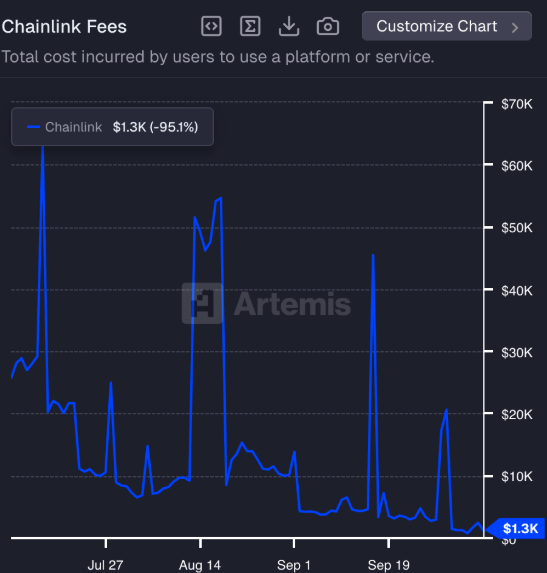
However, the gradual reduction in the costs of current services indicates depressed demand among all DeFi on the Chainlink oracle services.
A turnaround in network activity could signal a renewed interest from investors. This is especially true when new integrations or staking incentives are introduced in upcoming quarters.
Chainlink Price Approaching a Key Breakout Point
Technically, daily Chainlink price charts indicate a symmetrical tightening triangle, which has been developing since the end of May. The downward trendline connects rising lows near the 14 range.
This suggests consistent buying pressure. Meanwhile, the upward trendline is sloping downward. It indicates resistance around the 24–25 range.
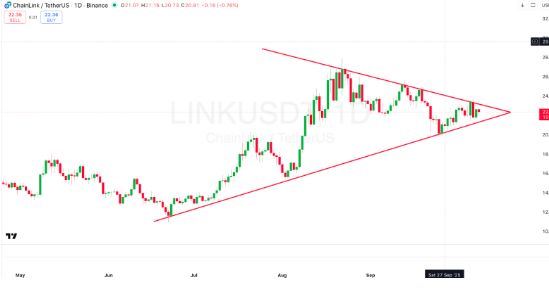
Such price action suggests that LINK is poised to break out of a critical level. A breakout of Chainlink price above $25 would confirm bullish momentum.
It could target previous resistance zones at $29 and $32. On the other hand, any break below 20 may indicate a short-term pullback to the $18 support level.