Claudia
 Bunker Mode
 Pearl
Pearl Starknet
 Solana
 NEAR Protocol
 Render

Stellar price has reached a key technical level. With this, analysts are noting renewed buying activity near $0.30 that could lead to a short-term rebound.
Recent market behavior suggests that the token is attempting to stabilize after a prolonged period of decline. Also, several indicators now indicate a potential recovery for the XLM price toward the $0.37 resistance zone.
Stellar Price Holds Support Amid Reversal Setup
Analyst Ali observed that the Stellar price is currently testing a critical support level around $0.30. That’s a significant historical point that has previously triggered bullish reversals.
XLM price remains in a downward channel, characterised by consistent lower highs and lows. This indicates ongoing bearish pressure.
The asset is positioned near the lower boundary of the channel. This may indicate a shift in sentiment, as buyers are defending the level.
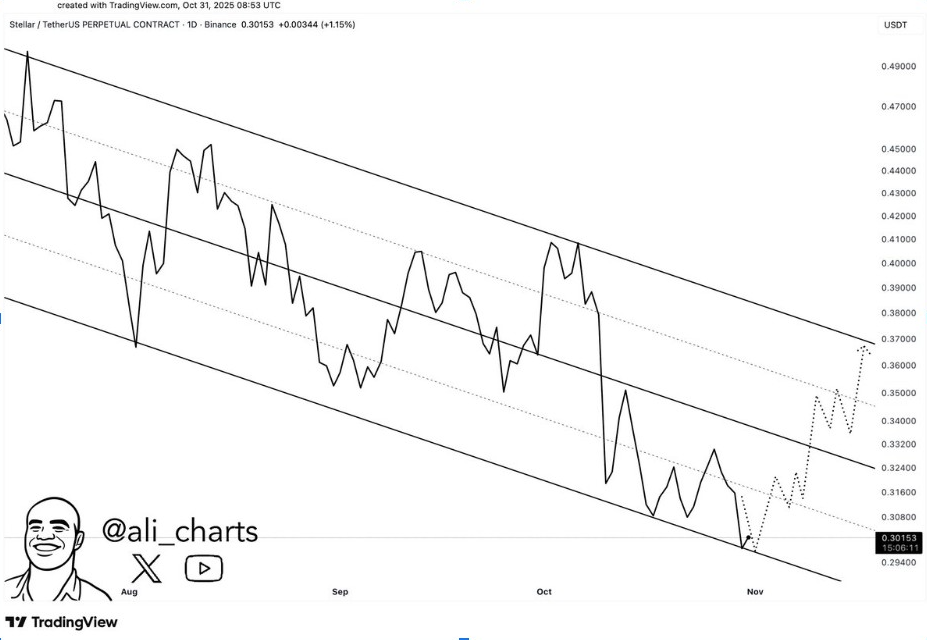
The analyst’s chart indicates that the Stellar price is likely to retrace to the $0.37 zone. This aligns with the channel’s midline, a sign of normal correctional growth after being oversold.
XLM price must remain above $0.30 to sustain its upward momentum. A close above $0.32 would confirm strength against short-term resistance. Notably, a further decline would put Stellar at greater risk of falling to the negative side near $0.29.
On the other hand, continued consolidation at support would encourage new momentum purchases. This would establish technical support for further upward movement in the weeks to come.
Ichimoku Cloud Suggests Cautious Recovery Potential
More so, the Relative Strength Index is close to 39, indicating bearish pressure. However, it is also an indication that the XLM price is about to enter the oversold zone.
A move above the 50 RSI would signal a shift in momentum toward the upside. This could set the stage for a push toward the $0.38–$0.40 zone. If volume grows around the prevailing levels, it will confirm accumulation and support recovery.
A dip below $0.29 would, however, initiate further retracement into the $0.24 support level. At the time of writing, Stellar was trading at around $0.305. Traders are closely watching for a potential breakout from the ongoing consolidation phase.
Another daily chart shared by analysts shows Stellar price consolidating just above the $0.30 psychological support level. The Ichimoku Cloud analysis highlights persistent downward pressure.
The price is still trading below both the Kijun-sen and Tenkan-sen lines. Despite this, the recent defense of the $0.30 zone indicates an ongoing accumulation.
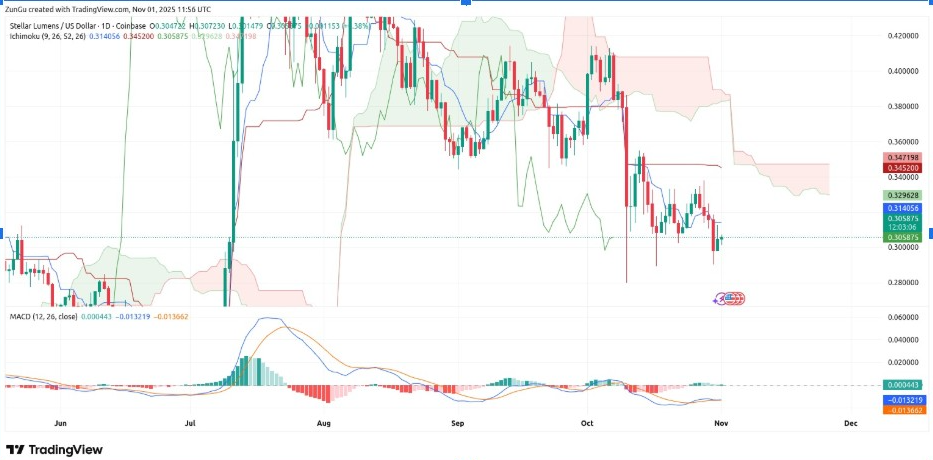
The Ichimoku Cloud indicates a bearish trend through November, suggesting resistance in the $0.34-$0.35 zone. For a sustained recovery, the XLM price should close above the Kijun-sen near $0.314.
This could lead toward the upper limit. Most importantly, similar setups in earlier cycles led to rallies, although volume remains key for the confirmation. Furthermore, momentum indicators are beginning to align with this potential recovery.
The MACD histogram has turned positive. This signals weakening bearish momentum and the early stages of a possible bullish crossover.
Should buying pressure persist, the Stellar price could test the $0.33–$0.35 resistance in the short term. However, a close below $0.30 would invalidate this scenario and signal continued bearish control.
Stellar Price Indicates Compression Before Shift
On a longer timeframe, the multi-year Stellar chart reflects price compression between the Bollinger Bands. There, the middle band is close to the XLM price $0.318, and the lower band is close to the price of $0.294.
This narrow range is indicative of lower volatility, which typically leads to strong directional movement. In the past, these squeezes have led to breakout scenarios once momentum returns.
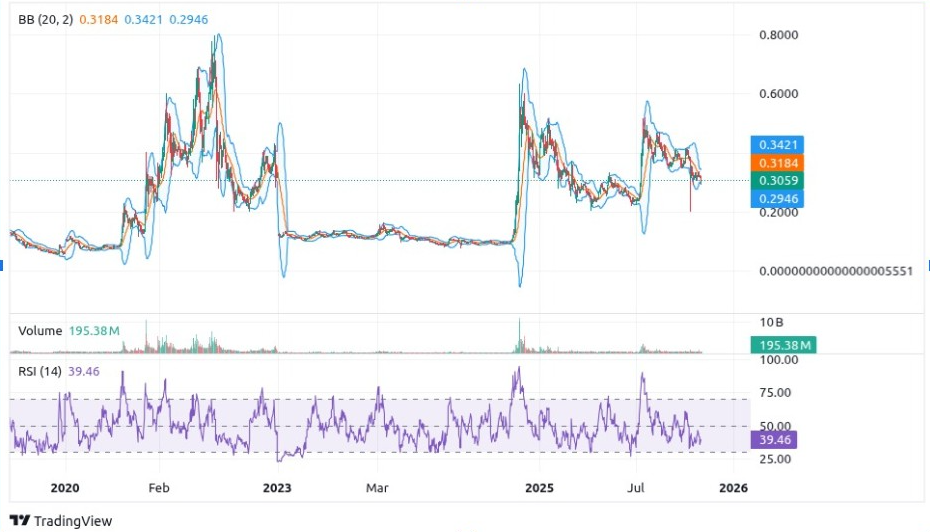
More so, the Relative Strength Index is close to 39, indicating bearish pressure. However, it is also an indication that the Stellar price is about to enter the oversold zone.
A move above the 50 RSI would signal a shift in momentum toward the upside. This could set the stage for a push toward the $0.38–$0.40 zone. If volume grows around the prevailing levels, it will confirm accumulation and support recovery.
A dip below $0.29 would, however, initiate further retracement into the $0.24 support level. At the time of writing, Stellar was trading at around $0.305. Traders are closely watching for a potential breakout from the ongoing consolidation phase.