Altai the Tiger
 Sword Inu
 streamoors
 IGNITION
 NEAR Protocol
 Pearl
Pearl Injective

The Binance Coin price has experienced a steep decline this month and is now hovering near its lowest level since October 11. Technical analysis suggests that the Binance Coin token has more downside in the near term despite its transactions and fees surge.
Binance Coin Price Technical Analysis Suggests More Downside is Possible
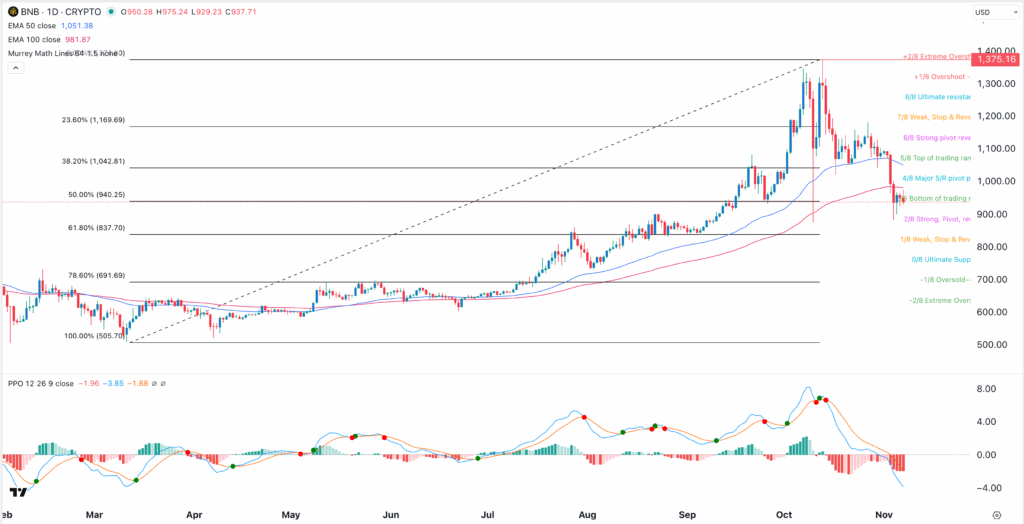
The daily timeframe chart reveals that the Binance Coin price surged to a record high of October 13 as the crypto market jumped.
It then crashed recently, moving to a low of $870 as the crypto market crashed and as investors embraced a risk-off sentiment.
The daily timeframe chart shows that it has more downside as it has also plunged below the 50% Fibonacci Retracement level. It also moved below the Major S/R pivot point of the Murrey Math Lines tool, a sign that bears are in control for now.
Most importantly, the coin has formed a double-top pattern at $1,343 and a neckline at $873, its lowest level on October 11. A double-top pattern often leads to more downside.
The BNB price is also in the process of forming a bearish pennant pattern. Also, the Percentage Price Oscillator (PPO$ has moved below the zero line.
Therefore, the most likely scenario is that the token continues to fall, potentially to the 61.8% Fibonacci Retracement level at $830. A drop below that level will point to more downside, potentially to the psychological level at $800.
On the other hand, a move above the psychological level at $1,000 will point to more gains.
BNB Price to Fall as Technicals and Fundamentals Diverge
The bearish BNB price forecast is happening as its fundamentals and technicals diverge. While its technicals are a bit weak, the token has some of the best fundamentals in the crypto industry.
Its first major bullish catalyst is that it is one of the fastest-growing network in the crypto industry. Data compiled by Nansen shows that the BSC Chain is experiencing a surge in activity as it continues to bridge the gap with Solana.
This data reveals that the number of transactions in the network jumped by 126% in the last 30 days. It handled 585 million transactions, making it the second-largest chain after Solana, which processed 1.8 billion transactions during the same period. Ethereum handled about 45 million transactions.
The soaring transactions on the network has resulted in a jump in fees. Nansen data revealed that the amount of fees stood at $60 million, a 108% surge in the last 30 days.
These numbers have a positive impact on the BNB price because the network normally burns most of the tokens. As a result, it is increasing the BNB burn rate, reducing the number of tokens in circulation.
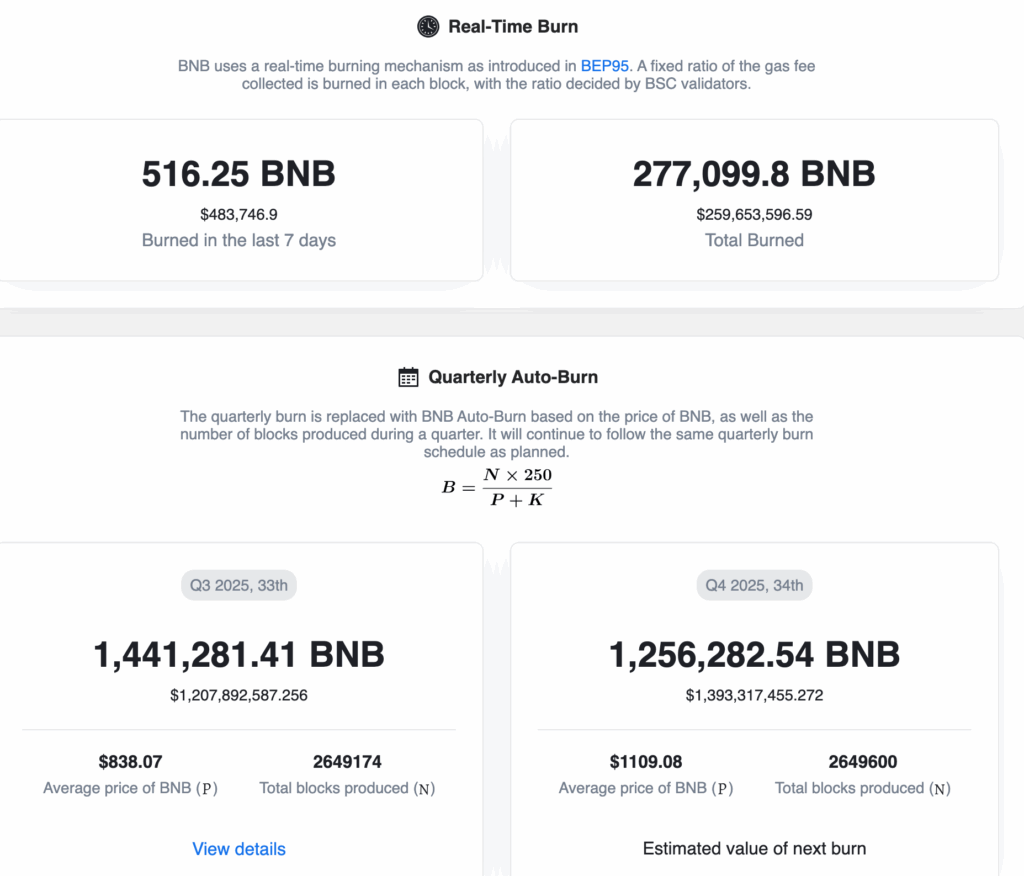
The BSC network has two ways of burning its tokens. It has the real-time burn and a quarterly one. In this case, the real-time burn has incinerated BNB tokens worth $480,200 in the last seven days, bringing the total burns since inception to over $258 million.
It also burns tokens per quarter based on the number of produced blocks. This approach burns tokens worth over $1.2 billion a quarter.
The BSC network has more bullish catalysts. For example, it is one of the biggest players in the decentralized finance industry, where it has a total value locked (TVL) of over $10.9 billion. It stablecoin supply has jumped to over $13.4 billion, a trend that may continue after the signing of the GENIUS Act.
Summary
The BNB price has been in a strong downtrend in the past few weeks, and technicals suggest that it has more downside to go. On the positive side, its fundamentals, including its burn rate, role in the DeFi industry, and the potential for a BNB ETF approval, may offset the decline.