streamoors
 IGNITION
 Sword Inu
 no crying in the casino
 Altai the Tiger
 Pearl
Pearl Pudgy Penguins

Ethereum price broke the significant support zone after a violent market downturn. The drop worsened volatility and broadened downside projections. Traders are now monitoring price reactions around the $2,600 and $2,400 areas.
Ethereum price Slides as $2,800 Support Fails
Ethereum price fell below the critical $2,800 level following constant sell pressure. The breakdown proved a structural shift in favor of lower supports. According to Ted Pillows, price tried to stabilize around $2,650 but had difficulty gaining momentum. His chart showed a series of rejections around $2,940 and $3,000, where each rebound was decisively rejected.
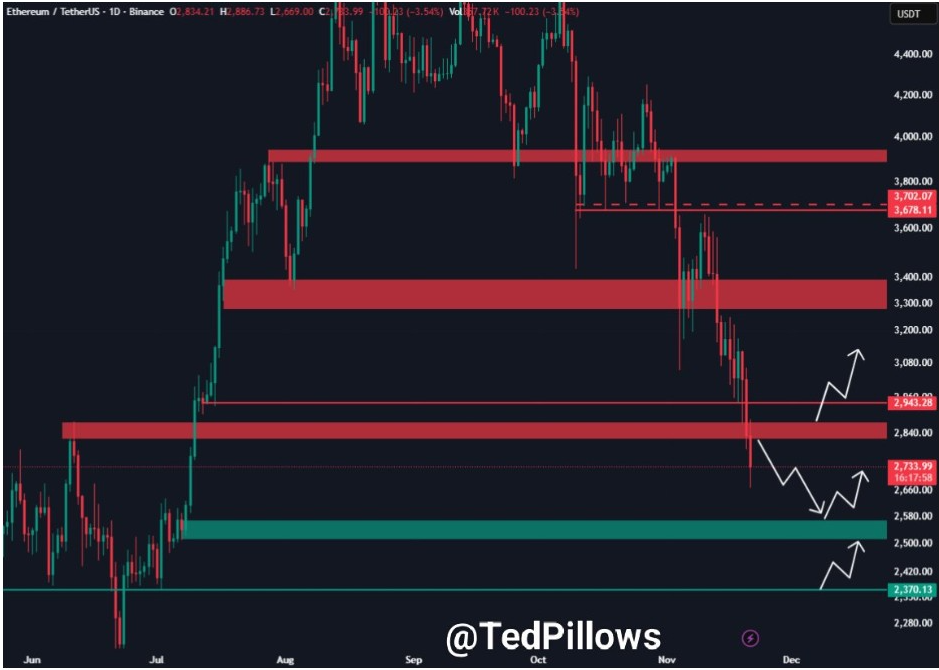
He added that the money to recover, $2,733, is critical to any early recovery effort. Failure to take $2,800 back opens a clear path for the $2,500 zone. His model has a thin demand from $2,650 to the low region. Buyers must regain control soon to prevent further momentum loss. Until then, bearish pressure is continuing to dominate the structure.
Wave Structure Suggests an Ongoing Cycle Correction
From a market cycle perspective, a wave-based interpretation also warns of deeper retracement risk. StockTraderMax noticed that the price has moved back to Wave 1 territory, eliminating the previous Wave 4 scenario. This shift confirmed a Wave 2 correction, which typically retraces deeper before major expansion. He added that the 0.618 Fibonacci level near $2,748 was a critical reaction point.
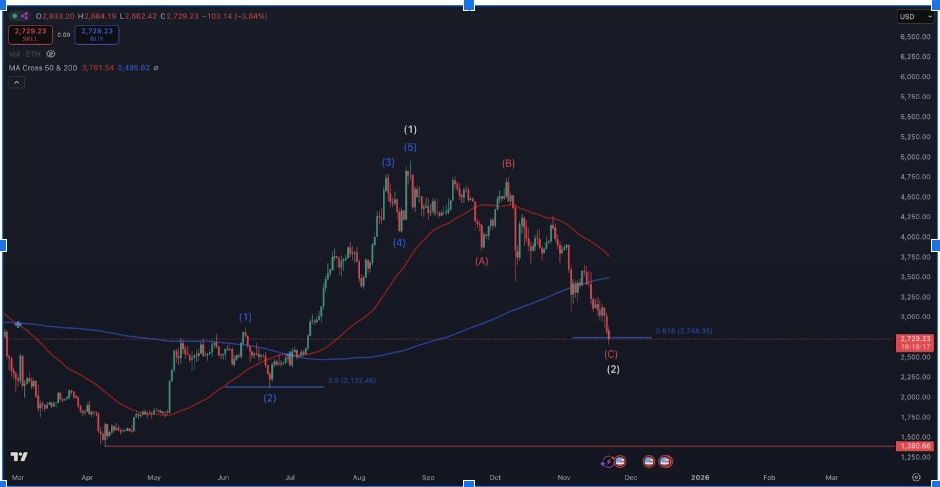
He did expect a local low if this area continues to hold. He has a broader picture that the cycle may be earlier than thought. If Wave 2 completes here, the following Wave 3 measure will kick off towards $ 8,800.
The upside target is also much bigger than previous projections. He said the short-term weakness is consistent with early-cycle retracement patterns. A firm higher low is required before momentum flips convincingly.
Channel Breakdown Increases Risk Towards $2.4K
Furthermore, pressure was also increasing as a long-term channel gave way on the weekly chart. Zoe pointed out that Ethereum slipped below the bottom of the rising channel, which was active for many months. She said the weekly close will prove decisive if the breakdown becomes so. A quick reclaim next week is still necessary to restore the pattern.
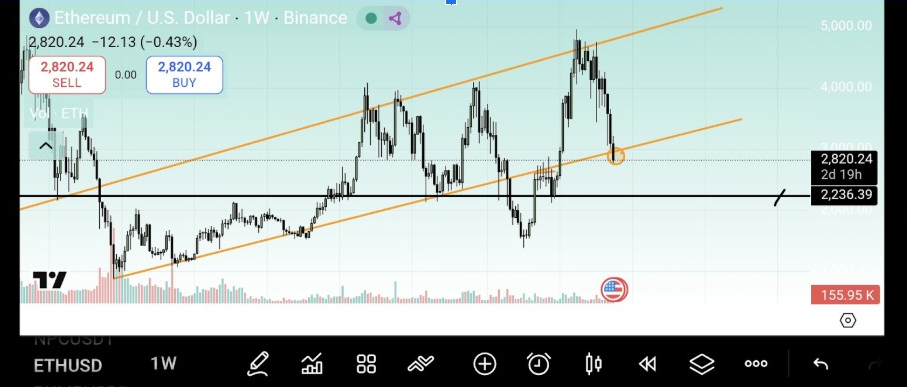
If the reclaim is unsuccessful, the next significant support comes at around $2,400. Her chart indicated more risk toward the $2,236 zone if selling continues. This area corresponds with the previous cycles of consolidation.
She added that prolonged retracement sequences often follow channel breaks. Market behavior during the next close of the week will determine the next directional phase. Bulls must react fast to avoid deeper structural damage.
Lower Targets Appear as Momentum Weakens Further
Selling pressure continued as the broader trend moved lower. Crypto Tony noted that ETH price has consistently made lower highs since October. His chart marked a failed midpoint retest and immediate rejection. He identified $2,600 as the next major support to watch out for.
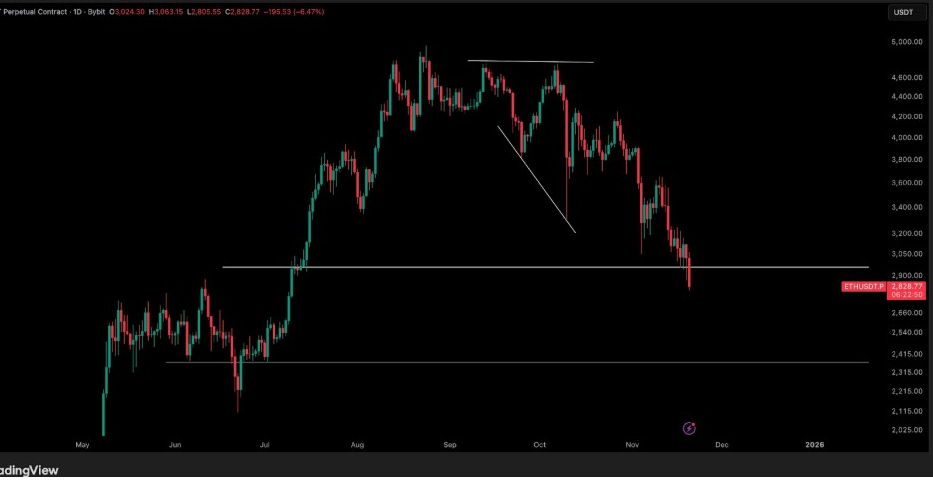
He said the loss of $2,800 validates a move into that range. The zone acted as a demand earlier in the year, making it a short-term support. If the top altcoin fails to stabilize there, the drop could extend to deeper levels.
Moreover, the analyst noted that buyers require a firm reversal pattern before any sustainable trend change. Until then, the structure continues to be in line with continued downside momentum.