Pearl
Pearl Ondo
Ondo Starknet
 Quantus
 Aerodrome Finance
 Pudgy Penguins
 Akash Network

Key Insights
- PEPE coin price maintains key support while compression tightens across higher timeframes.
- Breakout signals appear when lower-timeframe momentum starts to strengthen gradually.
- Market cap stabilizes below $2B, reinforcing long-term structural support conditions.
The PEPE coin price has formed a dangerous market structure, trading under a 2 billion market cap, despite levelling off at a multi-month support band. Pepe has undergone two significant trend-channel cycles since the start of 2024 and is tightening compressively on the daily chart.
PEPE coin price charts show the meme coin repeating the pattern previously observed in the June-November 2024 decline. The price was compressed for a long period within a descending channel. A sharp recovery rally commenced in late November 2024.
A fast multi-week expansion followed the Pepe coin price decline in December 2024 and early 2025. The breakout zone was soon followed by the price shooting into its March 2025 peak.
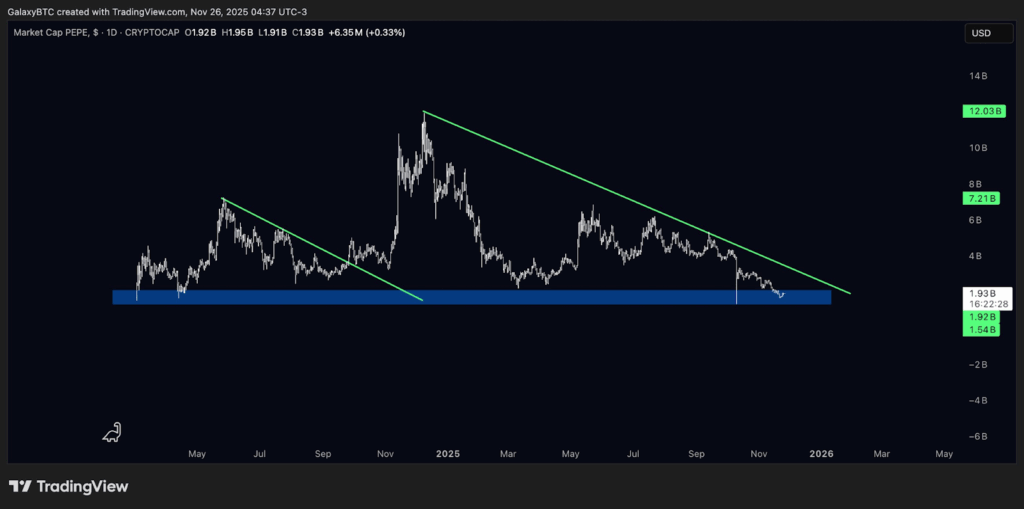
By late November 2025, PEPE is at the bottom of a second, almost identical channel. The price has been declining steadily since May 2025, and every low high coincides with a channel resistance trendline. There is no difference in the latest touch of the lower boundary as compared to one year ago.
The daily candles indicate a decrease in volatility and the distance between lows and the diagonal support area. This narrowing formation that appears in both trend channels is evidence that a structural pivot has been developing in the past few weeks.
Pepe Coin Price Movement Showing Breakout Momentum on Lower-Timeframes
Looking at four-hour Pepe coin price charts, we see distinct evidence of early breakout momentum. The recent price action violated a downward trendline that had been in place since the middle of November, completing the structure of PEPE. The break occurred from a low of around $0.00000428
The upward trend was also preceded by a change in a fair value (FVG) from previous months. This means that the trend had cleared previous inefficiencies as part of the trend change.
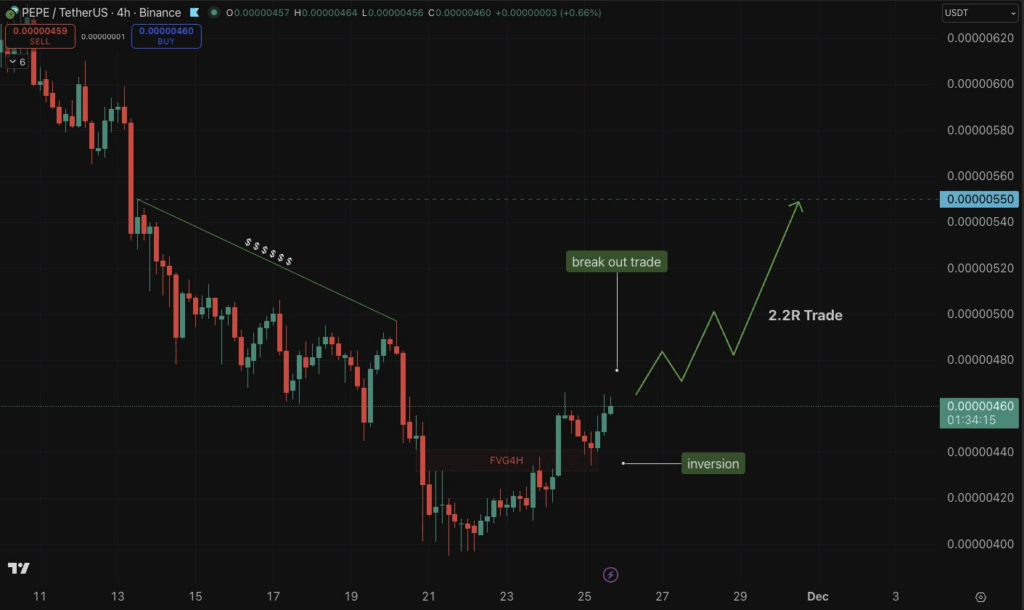
Analysts expect the breakout to continue in the same direction as 0.00000550. The trend shown in the chart is a sequence of high highs and high lows, which are in line with initial trend reversals. The target matches with a group of liquidity during the first week of November, which is the closest significant resistance.
The four-hour format seems to be in favor of the overall daily channel compression. The most recent higher-low pattern is visible against the backdrop of decelerating sell volume and an increase in buy-side order movement during the breakout. This bolsters confidence in the short-term structural change.
Market Cap Chart Shows Tight Range at Historical Support Zone
Examining data based on the PEPE market cap, we observe that the asset is currently valued at $1.92 billion. The chart indicates a downward trend line since the April 2025 market cap high, which is in line with the price trend of other charts. The market capitalization of PEPE has been steadily shrinking into a horizontal accumulation band since June. The zone was also one of the major support areas in the 2024 correction.
This area, which is between $1.54B and $1.93B, has been retained in numerous retests in the previous cycle. The chart demonstrates PEPE retesting the upper limit of that range one more time. The market cap is trying to recover the middle of that band again, but it is quickly lowered to its lower threshold.
The building illustrates a relationship between compression of market caps and compression of prices. This correlation confirms that the overall PEPE ecosystem has been condensing over the months as volatility decreases.