Quack AI
 NEAR Protocol
 Pudgy Penguins
 Pearl
Pearl Quant
Quant Quantus
 Sui
Sui

Ethereum price was trading near a decisive technical zone after slipping below the $3,000 level. Recent price action showed consolidation after months of volatility. Meanwhile, traders are now looking to see if ETH price can continue this recovery or fade once again.
Ethereum Price Breaks Below $3,000
Ethereum has fallen back to $2,970, dipping below the psychological $3,000 level after a short-lived intraday bounce. According to market data, a daily close above this zone is the key requirement. Analysts said that failure to support this level could reverse the recent upside move.
Ted Pillows highlighted that Ethereum price structure is still fragile despite the breakout. Price continues to face heavy resistance between $3,200 and $3,400. This zone served as a strong supply area during previous rallies.
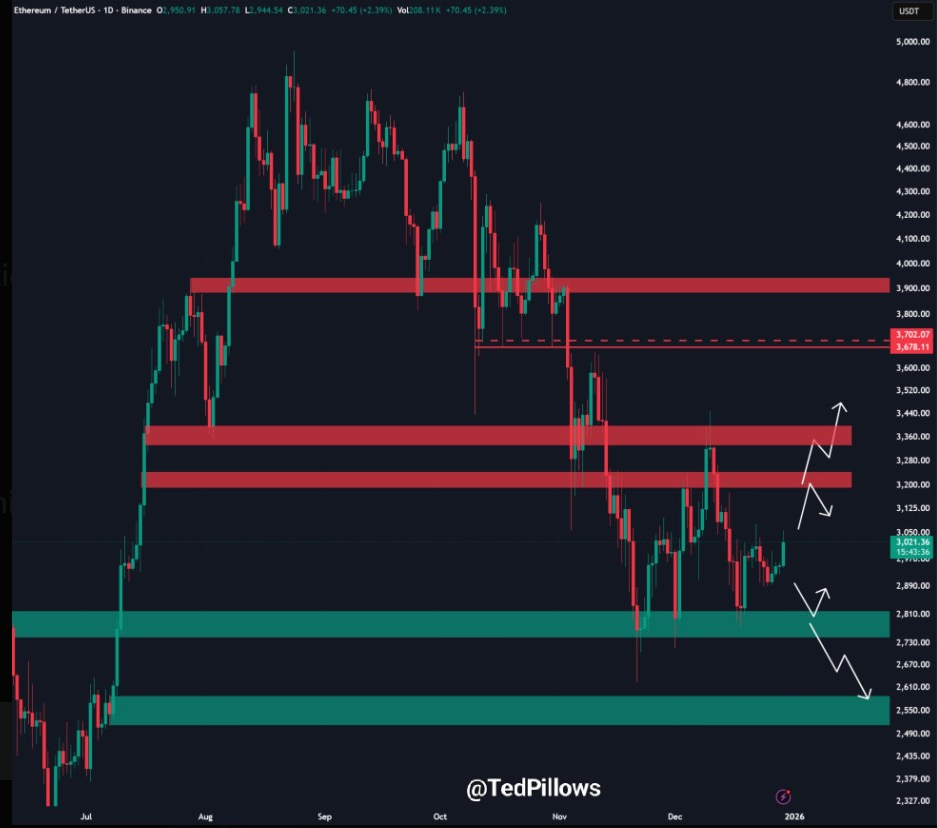
However, rejection from this region could throw the top altcoin drop back towards previous demand levels. Short-term momentum is also mixed with retail uncertainty. The market is now waiting for confirmation by sustained closes apart from intraday spikes.
Support Zones Define Ethereum’s Short-Term Direction
The downside risk on Ethereum is clearly defined on higher time frames. Charts indicated a major support band around the $2,900-$2,950 region. This zone has absorbed selling pressure several times in recent weeks.
Notably, Crypto The Boss emphasized that this is a green support to hold. As long as ETH is above it, upside scenarios are technically valid. However, a breakdown could expose Ethereum to deeper retracements.
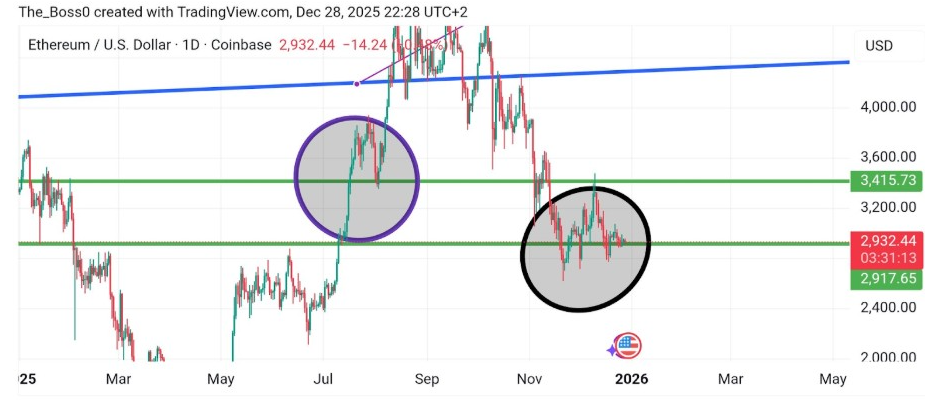
Below this level, the $2,700-$2,800 range gets attention. This zone represents the previous accumulation in the earlier phases of consolidation. Loss of both areas would be a hit to Ethereum’s overall recovery story.
Falling Wedge Pattern Suggests Upside Resolution
Additionally, Ethereum’s price action also suggested a larger structural setup. A falling wedge formation is seen in the chart shared by Don of Charts. This pattern often clears with a sharp directional move.
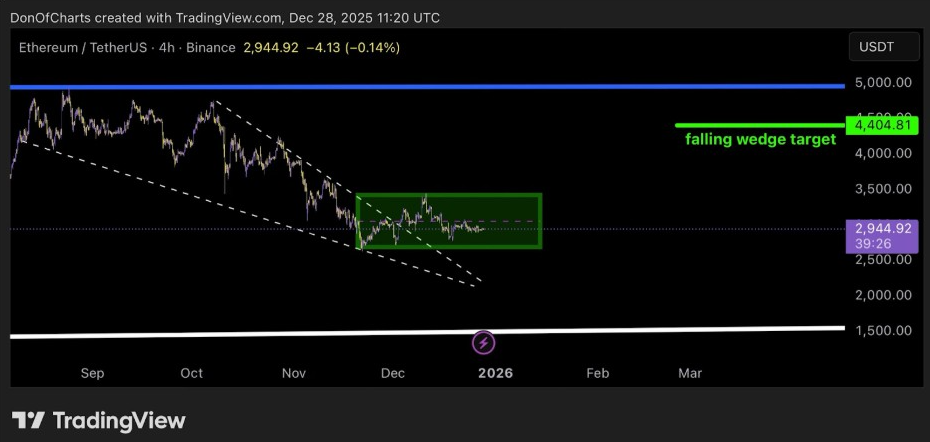
ETH price remained compressed within narrowing trendlines since late 2025. The expansion of volatility typically follows such compression. The estimated upside target from this structure is right around $4,400.
Still, the breakout needs to be confirmed through volume and momentum. Without strong participation, patterns can fail.
Monthly Performance Data Adds Context to Price Action
Ethereum’s historical monthly returns give more information. Data revealed that December has now turned green after several red months. This shift is after eight negative months earlier in the year.
Mister Crypto pointed out that seasonal recovery does not necessarily mean trend reversal. However, it often represents a period of stabilization following a period of prolonged weakness. ETH’s performance is comparable to other times during past cycles.
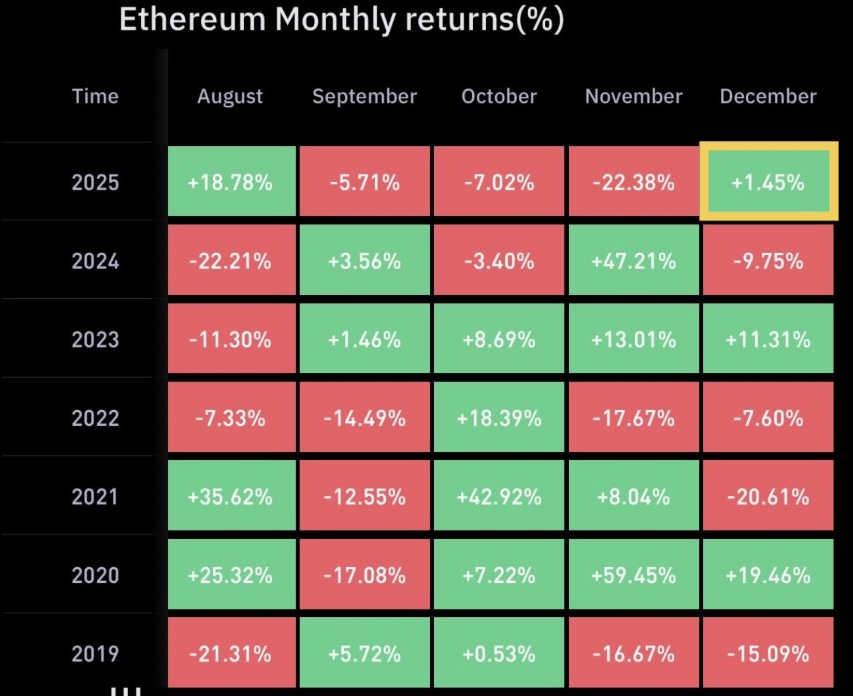
Moreover, Ethereum price is still far below its previous all-time high. This implies scope for expansion in case market conditions improve. Therefore, ETH is currently at a crossroads of recovery or rejection. The $3,000 level serves as technical support, preserving the bullish trend.
At the same time, resistance overhead is still heavy and well-defined. Price has to regain $3,200-$3,400 to turn sentiment decisively, while failure will see Ethereum price revert to range-bound trading.