
 Altai the Tiger
 IGNITION
 streamoors
 NEAR Protocol
 Sui
Sui Ethereum
 Pudgy Penguins

XRP price is holding above a confirmed multi-year breakout area on higher timeframes. Momentum is positive through short-term volatility. Traders are now watching structural levels that may mark the next expansion leg.
XRP Price is Supported Above Long-Term Breakout Structure
XRP price is still trading above the previous descending wedge breakout on higher timeframes. Analysts pointed to the completed accumulation phase between 2020 and 2024. Notably, this structure preceded a strong expansion move.
CryptoPatel reported a historical 600% rally from the $0.60 breakout area. He argued that the same base now supports continuation. The breakout also moved the market structure to higher highs and higher lows.
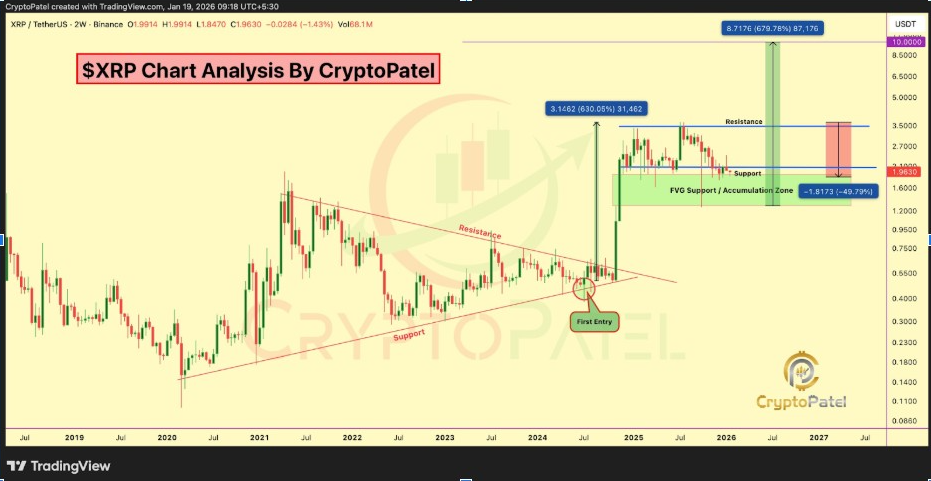
The chart showed price respecting a higher-timeframe bullish structure. The fair value gap support zone is between $1.90 and $1.30. This area served as a hot accumulation area. Buyers were able to defend the zone during the recent pullbacks. Price also still remains above the key invalidation level of $1.30. This condition maintains the wider bullish bias. Volume behavior is stable during consolidation phases.
CryptoPatel mapped upside targets at $3.50, $5.00, $8.70 and $10.00. These levels are consistent with past expansion projections. The resistance zone near $3.30 is very important.
A confirmed breakout above this level may open higher extensions. However, rejection could initiate another range rotation as traders track weekly candle closes for confirmation.
Structure Shows Expansion After Long Accumulation
The long-term structure was characterized by a descending wedge breakout, followed by a vertical expansion. XRP price rallied from below a dollar to the $3 range and formed a new, higher trading range. Consolidation later occurred above the breakout zone. Such behavior is often the marker for continuation phases, as investors perceive this structure as constructive.
Sacred made a direct fractal comparison between XRP 2017 and 2025 structures. His chart shows a similar four-wave accumulation pattern before expansion. In 2017, XRP moved by around 7,452% after fulfilling this structure.
The current setup represented similar compression and base formation. Sacred indicated this alignment is conducive to yet another explosive phase, with the condition that the structure remains intact.
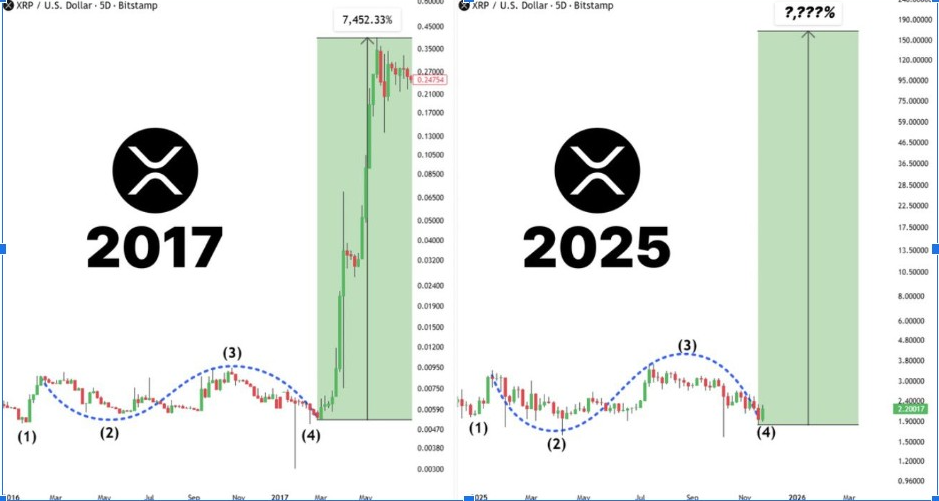
He also emphasized that price had recently filled in the fourth leg of the structure. That phase historically was the last stage of accumulation. After this stage in 2017, XRP went into parabolic expansion. Sacred said volatility is likely to remain in this transition. Still, he thinks the structural similarity bolsters long-term bullish probabilities.
Momentum indicators are showing mixed readings on a timeframe-to-timeframe basis. Higher timeframes are still a construct. Below are the cooling pressures on lower timeframes. This divergence is a result of consolidation and not trend failure. Buyers are still supporting structural support zones. That defense keeps the bullish expectations on longer horizons.
Short-Term Patterns Indicate Volatility Risk Zones
Short-term charts showed corrective structures forming below resistance. JD has highlighted bearish divergence on the three-day time frame. He also had a grey supply zone overhead. According to his analysis, XRP price may experience another corrective leg. He expects further retracements to gain strength for future breakouts. Such pullbacks often reset overheated indicators.
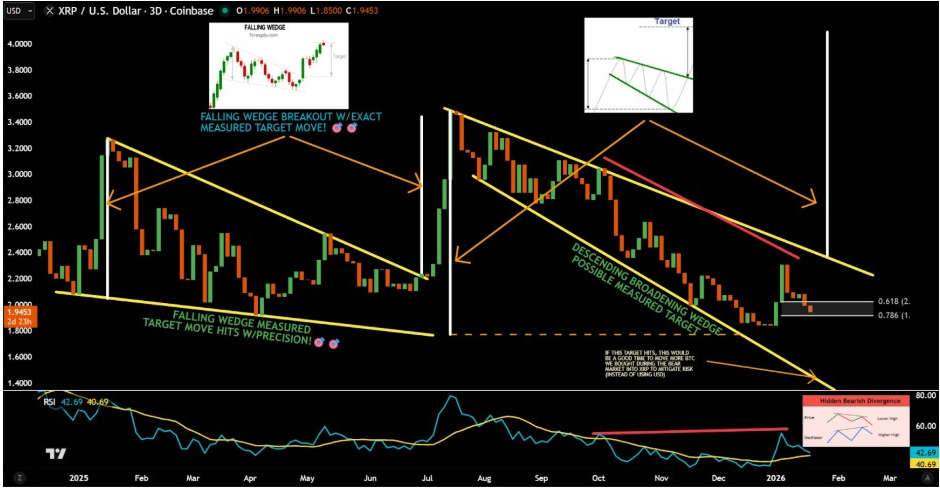
The pattern also indicated a descending broadening wedge on intermediate timeframes. This structure precedes volatility expansion in most cases. XRP price is currently trading near the midpoint of the wedge. There is a possibility of testing Fibonacci retracement zones with a downside sweep. These include the 0.618 and 0.786 levels near lower support. Traders watch these areas for possible reactions.
JD also argued that stronger rallies often follow deeper pullbacks. He called this phase liquidity flush. His view proposes the elimination of weaker hands during consolidation. Stronger hands then go back in near support. This cycle was historically preceded by major upside moves in prior market phases.
Long-Term Outlook Aligns Institutional Signals
Meanwhile, institutional narratives have boosted XRP price sentiment. The Crypto Squire got buzz going again with “DAVOS REWIND III,” in anticipation of Ripple CEO Brad Garlinghouse’s appearance at the World Economic Forum from January 19 to January 23rd. The clip revisits Garlinghouse’s Bloomberg interview, in which he said crypto is at a regulatory crossroads and emphasized the need to future-proof digital assets.
Ripple’s increasing presence at Davos supports this outlook. Reports from Ripple-backed panels on tokenization and enterprise blockchain adoption. Garlinghouse is predicted to speak on real-world asset tokenization and regulatory alignment. Community reactions are mixed, with optimism and frustration, though institutional exposure tends to boost long-term confidence.



