Boomer
 Pearl
Pearl Covenant x402
 Claudia
 Bitcoin
 hi
hi NEAR Protocol

Shiba Inu price extended its rebound on Monday as chart structure and derivatives activity turned firmer together. The token traded at $0.00000631, up 4.8%, as broader crypto strength supported risk appetite.
At the same time, short sellers absorbed most liquidations as SHIB price pushed above a near-term resistance zone.
Shiba Inu Price Breakout Improves Short-term Chart Structure
The daily chart indicated that Shiba Inu price broke above a short counter-trendline that capped recent recovery attempts.
That move is significant, as it represents the most obvious short-term improvement after months of lower highs. Price also moved above the $0.00000590 area, which had served as a nearby resistance band.
Analyst World of Charts said SHIB price had delivered a clean breakout from the counter-trendline, showing short-term strength. He mapped the next move towards the upper descending trendline, which is still the main area of resistance. His setup has it that a break above that level could open the door to a much bigger advance.
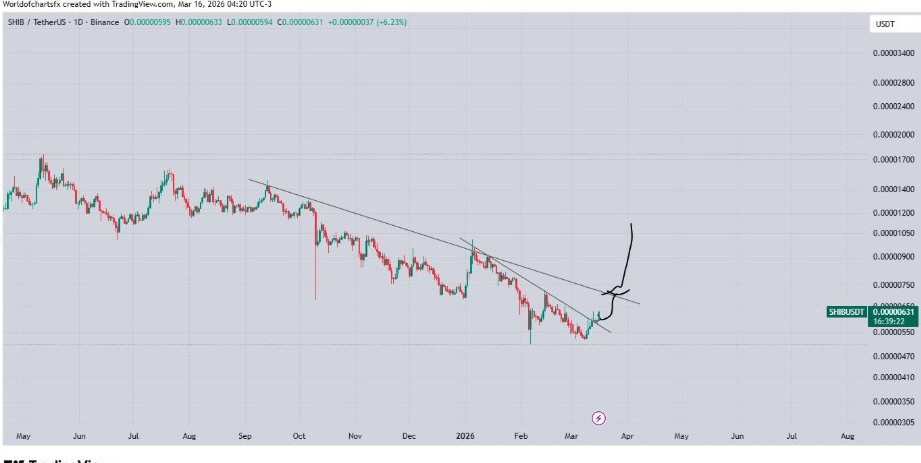
Even so, the larger chart still shows a descending trendline extending down from late 2025 highs. That upper falling trendline is still the next major bar above the current zone. As long as SHIB remains below it, the bigger structure still leans cautiously.
Short Sellers Take the Bigger Hit Again
However, the rebound has continued to squeeze the bearish positions. In the last 24 hours, Shiba Inu has had liquidations totaling $154.48K, with shorts responsible for $103.42K and the other longs for $51.06K. That means that bears carried the bigger portion of forced exits during the latest leg higher.
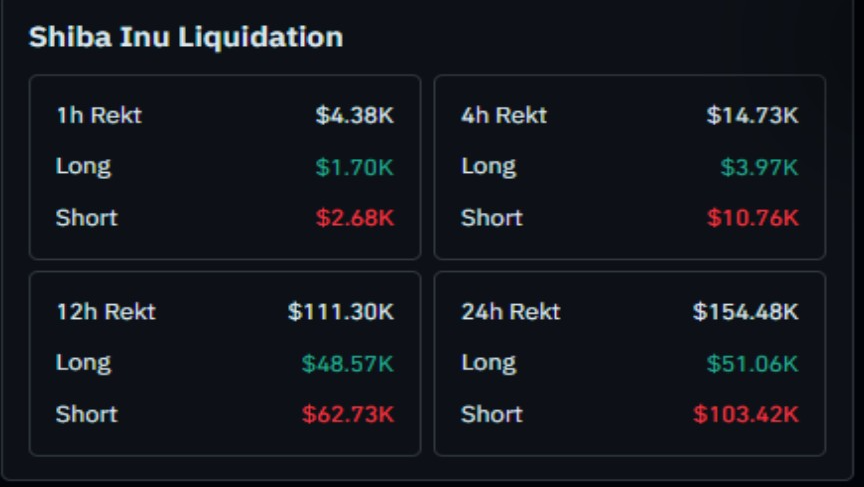
The 12-hour data also turned against short sellers. Total liquidations amounted to $111.30K, where $62.73K was in shorts and $48.57K was in longs. Over the last four hours, the liquidations were at $14.73K with $10.76K tied to shorts, while the one-hour total was at $4.38K.
This imbalance implies the rebound continued to catch traders positioned for further downside. As short sellers closed out of their positions, that forced buying likely added support to the price move. In turn, the liquidation trend was commensurate with the better spot action and improving chart setup for SHIB.
Open Interest and Volume Point to Stronger Participation
Notably, the rebound has also been supported by firmer market activity. Open interest rose from about $54.51 million on March 1 to $60.90 million. Rising open interest in a price recovery is often a sign of traders returning to the market.
In the past 24 hours, spot trading volume increased 112% to $22.23 million. Futures volume also rose 109% to $148.3 million in the same period. That growth in both the spot and futures activity suggests the rebound is becoming a broad-based movement.
At the same time, taker buy and sell orders are close to equilibrium. That indicates that activity has improved, although traders still do not have a clear one-sided bias. In practical terms, the market is active but still waits for stronger confirmation.
SHIB is also on track for the seventh green daily candle in the last eight sessions. That run was after a rebound from weekly support at around $0.00000520 on March 8. From that low, the token has bounced 20%.
SHIB Upper Trendline Remains Next Major Test
Meanwhile, the next target is at the upper descending trendline that is visible on the chart. That line capped earlier recovery attempts and is the main resistance zone in the current structure. World of Charts identified that area as the next major hurdle after the counter-trendline break.
For a stronger structural shift, SHIB would have to break above the previous lower high at around $0.00000725 back on February 14. That level is significant because January and February rebounds still ended with low highs. Until that pattern changes, the larger market can still argue that SHIB is still inside a bearish pattern.