Doge Pepe
 Zylo Ecosystem
 Crawlerpad
 Pearl
Pearl Quantus
 Starknet
 Quant
Quant

Shiba Inu price has fallen back to one of the most critical levels of its history after a selloff last week. A 15% drawdown has pulled SHIB back towards its long-term demand zone near $0.0000066, a level that has been the definition of past cycle lows multiple times. Whether this support holds might mean the difference between SHIB’s pattern of diminishing returns continuing or finally breaking.
Weekly Structure Puts Shiba Inu Price at a Historical Support
On the weekly chart, analyst Ali Martinez emphasized that everything hinges on whether SHIB can hold the $0.0000066721 support zone. This level aligns with SHIB’s lifetime demand area, which in the past has preceded shifts into bullish territory. Price action has now snapped back to this band after months of declining highs and fading speculative momentum.

However, the situation is different than what it was in previous cycles. Each bull run since launch has led to weaker upside gains, raising concerns that SHIB’s speculative appeal is in structural decline. While the support has not yet broken, buyers are obviously more cautious than in previous retests.
The broader weekly structure still reflects consolidation but not collapse. That distinction is important because sustained closes below this zone would signal a regime shift. As long as price holds, the market remains in the compression phase as opposed to a confirmed breakdown.
Liquidity Flush and Derivatives Data Indicate De-risking
The recent selling off triggered mass liquidations throughout SHIB’s derivatives markets. Roughly $2.45 billion in liquidations occurred on the downside, accelerating into the weekend. Long positions took most of the damage, some $2.27 billion, while shorts suffered relatively limited losses.
According to CoinGlass data, open interest has since declined by 15% to about $75 million. This decline indicates the pull-out could be less about aggressive repositioning and more of a sell-out. Such behavior is usually a sign of risk reduction rather than new bearish conviction.
Shibarium core team member Lucie described the move as a familiar cycle of over-leverage followed by panic and forced selling. From that perspective, perhaps the washout is not about structural failure. Still, the lack of immediate re-engagement indicates that confidence remains fragile.
Compression Patterns Suggest Volatility Expansion
Despite the heavy liquidation, several analysts have identified compression patterns that are often followed by sharp moves. Crypto commentator CRYPTO SHIB said SHIB price is trading within symmetrical compression with lower highs touching higher lows. Volatility has contracted near the $0.0000066 support zone, while volume continues to dry up.
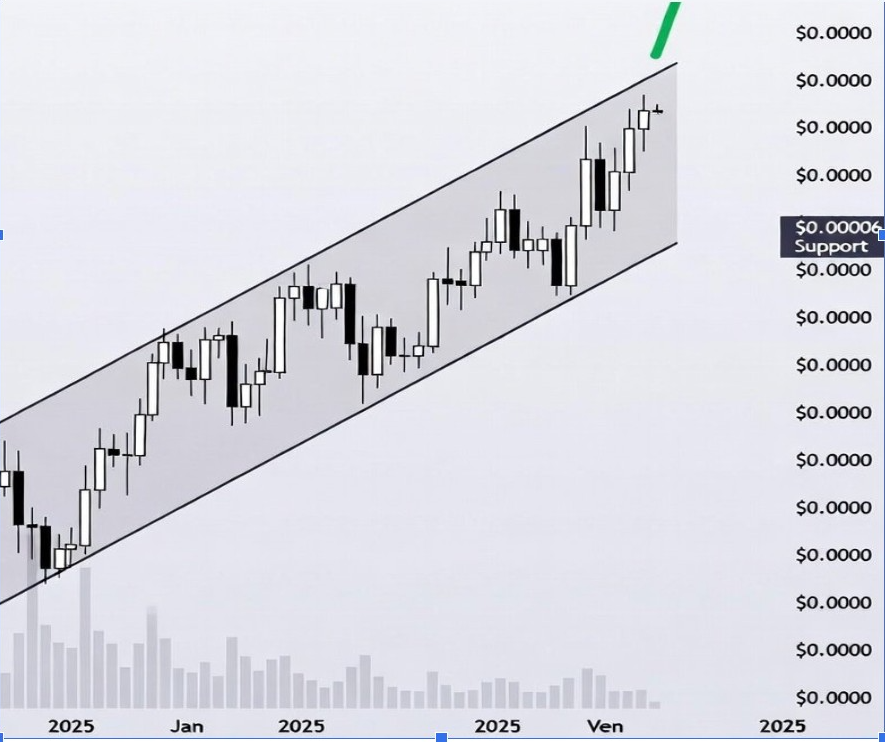
Such conditions often serve as a prelude to expansion. However, compression does not ensure upside, but it does increase the odds of a clean breakout when structure is resolved.
On the daily time frame, SHIB is still holding a year-long falling wedge.
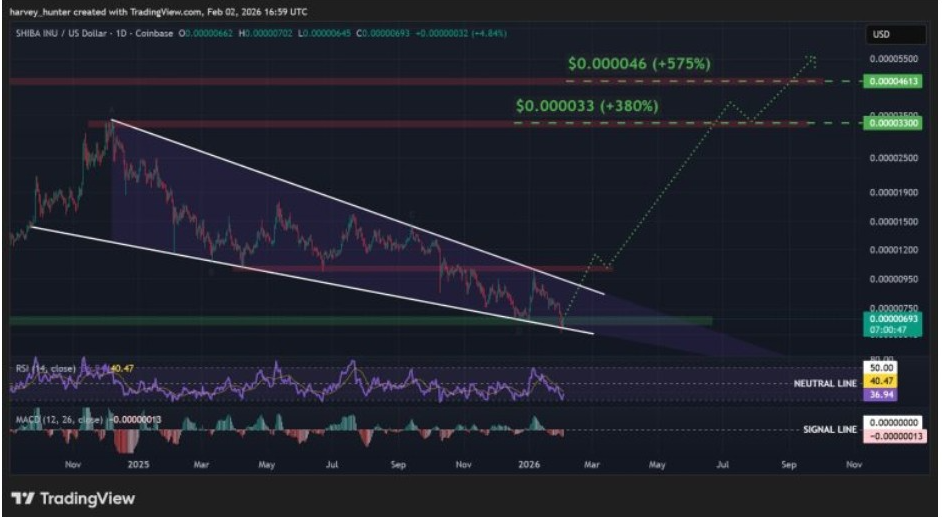
The pattern is now coming into the apex, and the current retest of the lifelong demand zone is potentially the final low before resolution. Failure to hold here would invalidate the bullish wedge thesis.
Momentum Indicators Reveal Early Signs of Seller Exhaustion
Momentum tools are starting to suggest that downside pressure is weakening. The Relative Strength Index is now way back from the point of 30 oversold, which is generally considered a zone of sellers exhaustion. While this is not a buy signal on its own, this rebound is a sign that aggressive selling may be losing steam.
The MACD has also turned up to a possible golden cross on the daily chart. Historically, this set-up is often found in the early stages of mid-term trend reversals. Confirmation, however, still requires follow-through above nearby resistance.
For a bullish resolution, analysts consider $0.00001 to be the key breakout threshold. If this is sustained above that level, it would confirm the wedge breakout and open the door to a measured move towards $0.000033, representing about 380% upside. In a more favorable macro environment, prolonged gains towards prior all-time highs of near $0.000042 would suggest upside closer to 575%.