Dacity Coin
 Injective
 Pump.fun
 Pearl
Pearl Starknet
 Quantus
 NEAR Protocol

Ethereum price has continued its consolidation this week, even as a risk-on sentiment has prevailed in the financial markets. ETH token was trading at $1,910 on Thursday, inside the range it has been in in the past few weeks.
This price is about 26% above its lowest level this year. Is this the calm before the storm as ETH ETF inflows jump?
Rising Ethereum ETF Inflows Point to Accumulation
There are signs that Ethereum has moved into the accumulation stage. That may ultimately result in a strong bullish breakout this year. One of the main pointers is that American investors have continued buying ETH ETFs.
Data shows that spot ETH ETFs added $60.8 million in assets on Wednesday. BlackRock’s ETHA added $50.3 million. The other ETFs in terms of their inflows were BlackRock’s ETHB, Fidelity’s FETH, and Bitwise’s ETHW.
A day earlier, these funds added $53 million in inflows. That brought the monthly inflows to $103 million. Just last month, these ETFs added over $365 million in assets, ending two months of outflows.
Therefore, there is a likelihood that smart money investors are buying the dip after Ethereum plunged into a bear market. It bottomed at $1,505 in July, down by about 70% from its highest level this year.
Institutional investors buying an asset is a bullish aspect in most cases. Indeed, more data shows that the amount of ETH tokens in exchanges has been in a downward trend in the past few months. They stand at 2.49 million ETH tokens, down sharply from last year’s high of 3.2 million.
Despite its consolidation, Ethereum is also seeing strong traction in the futures market. There, the open interest has moved to $26 billion from the July low of $22 billion.
Macro Trends Support Ethereum Price Rally
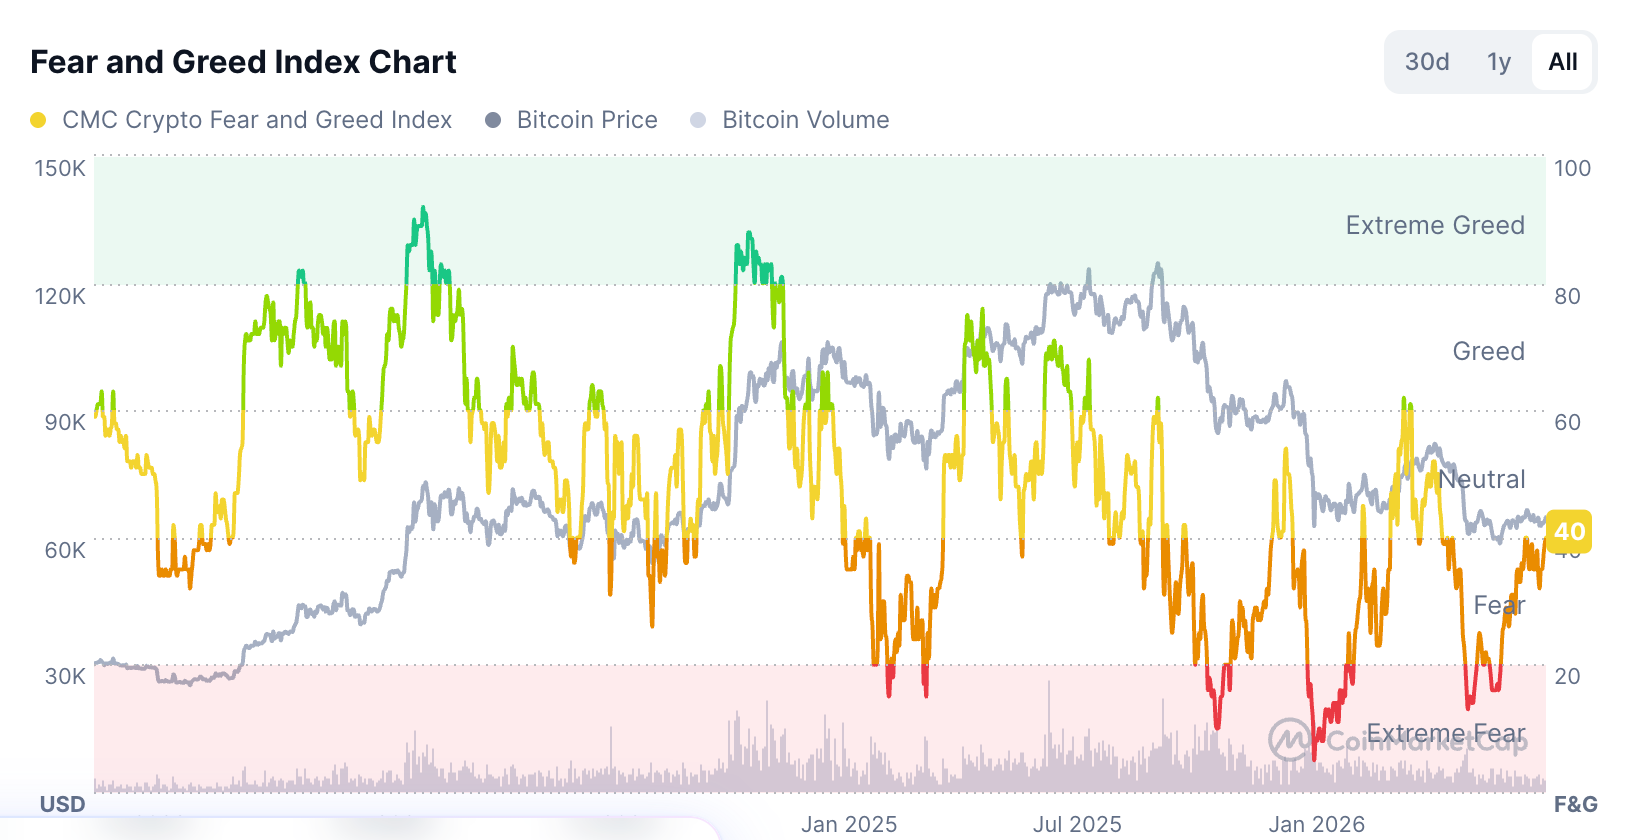
There are several other reasons why the Ethereum price may be on the cusp of a bullish breakout. First, the Crypto Fear and Greed Index has moved from the extreme fear zone of 17 in June to the neutral level of 40.
While this index has stalled recently, it may continue rising and cross the green zone soon. In most cases, Bitcoin and Ethereum prices do well when there is a sense of greed in the market.
From a macro perspective, there are signs that investors have embraced a risk-on sentiment. Furthermore, the S&P 500 Index soared to a record high this week.
Other indices like the Dow Jones and Nasdaq 100 have also soared. At the same time, crude oil prices have continued falling, with Brent and WTI moving below $80.
Therefore, if the stock market rally continues, there is a likelihood that the crypto market will also follow.
Additionally, some Ethereum fundamentals are improving. The total value locked (TVL) in its DeFi industry has crossed the $40 billion mark.
Ethereum Price Technical Analysis
The daily chart shows that ETH price has some bullish technicals. It formed a double-bottom pattern at $1,515 in June. It then moved above the neckline at $1,854, its highest level on June 15 this year.
Most notably, after moving above this level, the coin retested it, completing the break-and-retest pattern. It has also moved slightly above the 50-day Exponential Moving Average (EMA), which is a bullish sign.
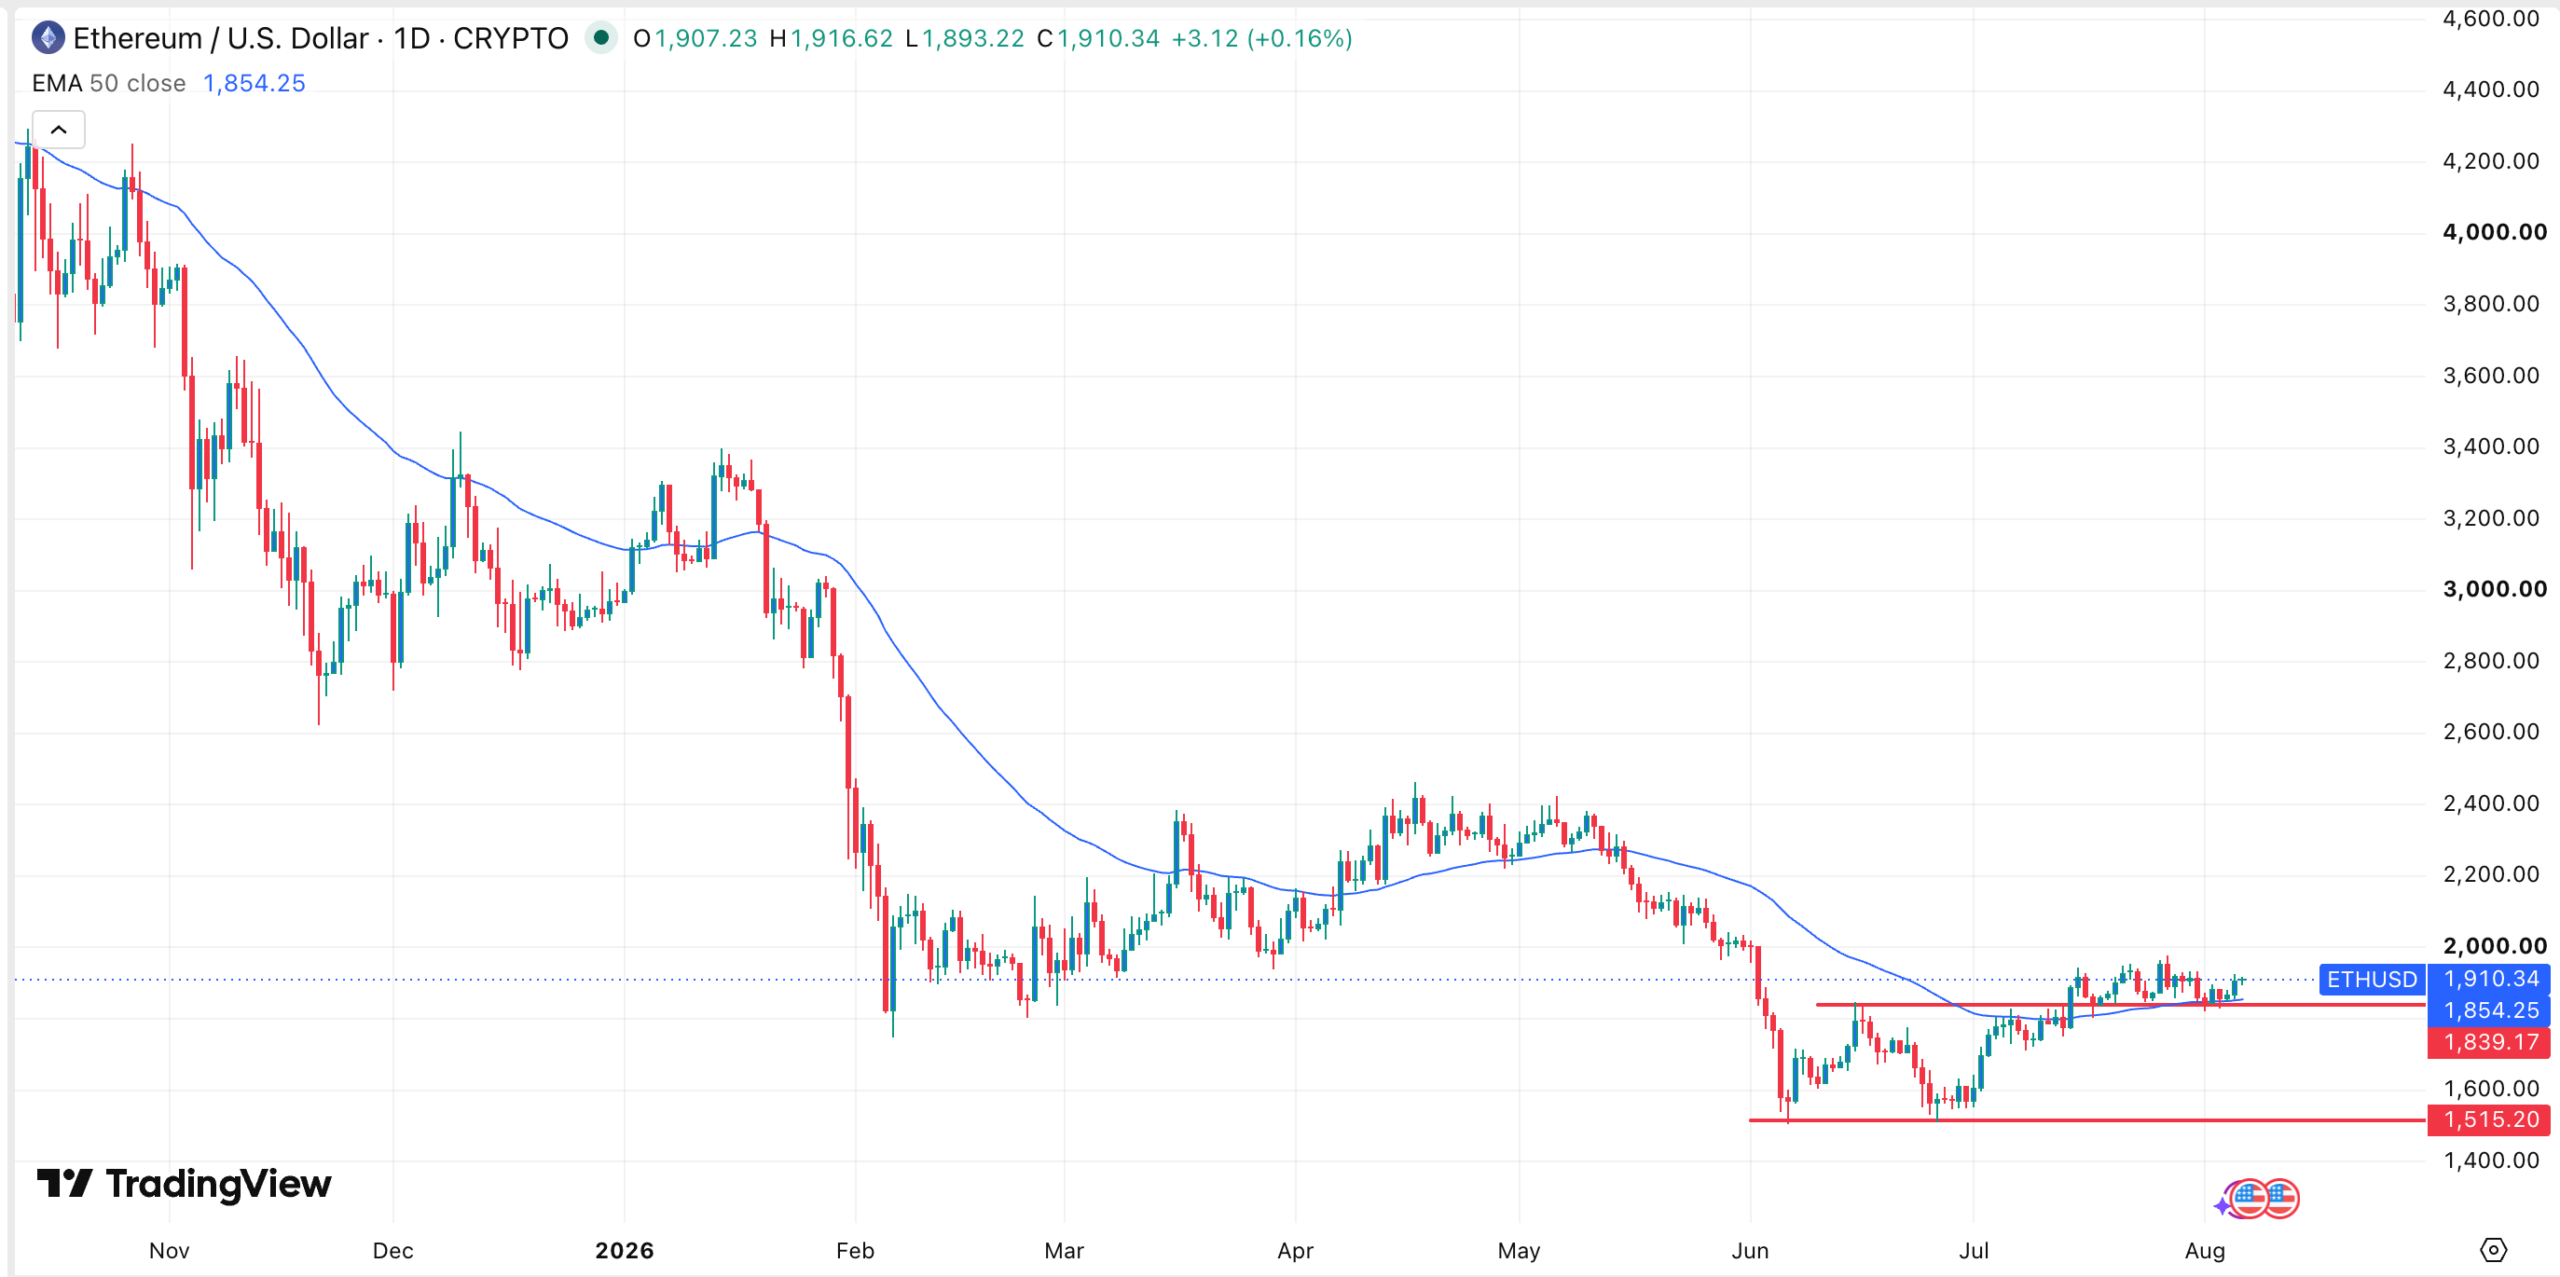
Therefore, the Ethereum price will likely continue rising, potentially to the psychological level of $2,000. If this happens, the next level to watch will be at $2,500. A drop below the neckline of $1,850 will invalidate the bullish outlook.