Dacity Coin
 Injective
 Pearl
Pearl Quantus
 NEAR Protocol
 Bittensor
 Bitcoin

Bitcoin traded near $64,000 on Aug. 5 as traders assessed a renewed Bitcoin bottom signal against weak spot demand. Ali Martinez linked the signal to a bullish divergence between price and net capital flows.
The setup mattered because Bitcoin remained below levels required to repair its daily structure. Older coins also moved toward Coinbase while its premium stayed negative, testing U.S. demand.
Bitcoin Bottom Signal Emerges Near $64,000
CoinGecko priced Bitcoin near $63,850, with a 24-hour range between $62,785 and $64,960. Trading volume reached about $26.02 billion, while market capitalization stood near $1.28 trillion.
The price remained nearly 49% below its Oct. 6, 2025, record of nearly $126,080. That distance left the market vulnerable to competing interpretations of the latest capital-flow divergence.
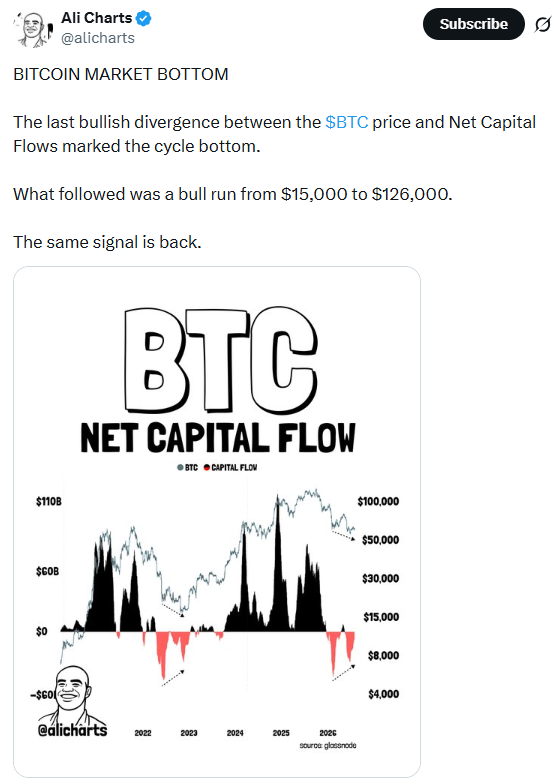
Ali Martinez described a bullish divergence between Bitcoin price and net capital flows. He said the previous occurrence aligned with the cycle bottom near $15,000.
Bitcoin later advanced toward its record high after that earlier setup. However, the recurring indicator alone did not confirm another bottom or establish timing.
Bitcoin Price Faces a $67,000 Structure Test
Daan Crypto Trades identified $67,000 as the June and July high. He said a breakout would create a higher high on the daily chart.
That move would also shift the current structure toward buyers. Until then, Bitcoin remains inside a broad range rather than a confirmed upward trend.
Ted Pillows placed immediate resistance near $65,000 and the next target around $70,000. He warned that rejection could return the BTC price toward lower support.
Both traders identified $60,000 as the larger range floor. A sustained break below that level would weaken the bottom thesis and expose February’s lows.
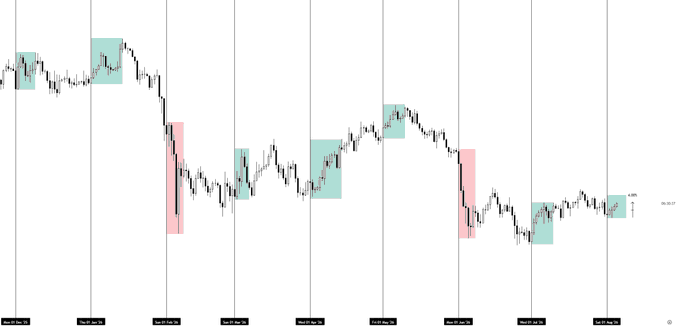
Killa projected a move above $80,000 after completing a bottoming formation. His outlook relied on wave structure, trader psychology, and perceived market-maker behavior.
Those methods involve subjective chart interpretation and provide no fixed completion date. Price confirmation therefore carries greater weight than the projected target.
Kalshi’s market pricing offered a bearish counterweight. Ted cited a 50% probability that Bitcoin would reach $50,000 before returning to $100,000.
Prediction-market probabilities reflect contract positioning rather than confirmed future outcomes. They can shift quickly with liquidity, sentiment, and Bitcoin price movements.
Bitcoin Bottom Signal Meets Dormant-Coin Inflows
CryptoQuant contributor CryptoOnchain reported unusually high Coinbase netflows during the reviewed period. Netflows rose about 838% above their 30-day average.
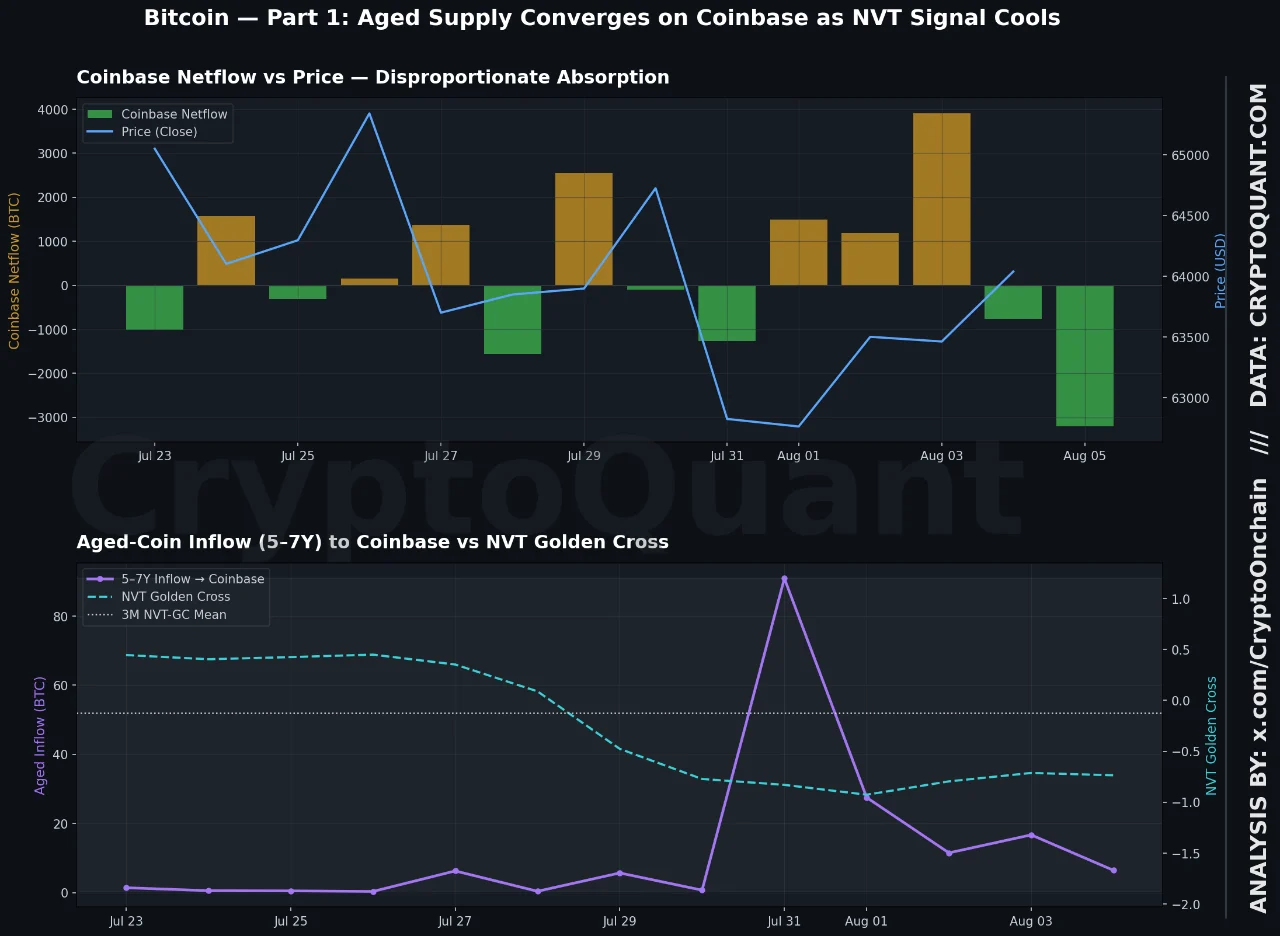
The reading stood nearly 29,760% above the three-month baseline, although the author noted a low comparison base. Coinbase inflows from five-to seven-year coins rose above 1,000% versus that quarterly baseline.
Spending from three-to-five-year wallets also increased almost 600% week over week. CryptoOnchain valued the realized movement from that group near $367 million.
CryptoQuant defines exchange netflow as inflows minus outflows from identified exchange wallets. Positive readings can show more idle coins becoming available for trading.
Its exchange clusters receive periodic updates as new wallets receive identification. CryptoQuant therefore warns that recent and historical flow readings can later receive revisions.
Binance showed less consistent movement during the same 14-day period. Its netflow shifted from a 5,124 BTC outflow to a 3,289 BTC inflow.
That comparison suggested older-coin activity concentrated on Coinbase rather than all major exchanges. It did not prove holders intended immediate sales.
Bitcoin Price Signals Show Weak U.S. Spot Demand
CryptoOnchain reported a negative Coinbase Premium between minus 0.04 and minus 0.14. The indicator failed to record a positive reading during the observed period.
CryptoQuant uses the Coinbase Premium to compare Coinbase’s U.S. dollar market with Binance’s Tether market. A weak premium can indicate limited buying pressure from Coinbase participants.
The Network Value to Transactions Golden Cross also fell sharply from an earlier undervaluation reading. CryptoOnchain reported declines exceeding 300% weekly and 1,200% against the quarterly baseline.
Funding on Binance remained near zero to 0.01 during the period. Binance states that positive funding requires longs to pay shorts, while negative funding reverses that payment.
Near-zero funding suggested restrained leveraged positioning rather than crowded bullish exposure. That reduced immediate liquidation pressure but offered little confirmation of strong demand.
Bitcoin’s next verifiable test remains the $65,000 resistance area, followed by $67,000. A daily break above the latter would support the Bitcoin bottom signal, while $60,000 remains decisive support.