Dacity Coin
 Bitcoin
 Pearl
Pearl NEAR Protocol
 Quantus
 Bittensor
 Pudgy Penguins

Bitcoin traded near $62,831 late Aug. 14 as sellers defended $65,000. The Bitcoin price remained exposed to lower liquidity targets after repeated rejection attempts.
The setup mattered because several independent indicators pointed toward unresolved downside risk. Futures pricing, liquidation zones, and volatility compression kept traders focused on nearby support.
Bitcoin Price Holds Near $62,000 After Repeated Rejections
Bitcoin traded at $62,831 after falling about 0.9% during the session. Market data showed an intraday range between $62,538 and $63,542.
CME Group’s Aug. 14 Bitcoin futures quote stood near $62,850. The contract fell about 0.98%, while reported volume reached 2,536 contracts.
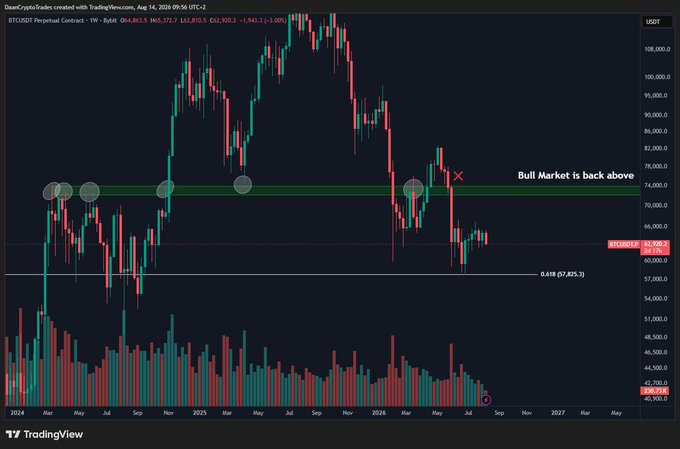
Daan Crypto Trades said Bitcoin had repeatedly failed above the $65,000 area. He also noted equities remained near record highs while crypto lagged.
His Aug. 14 commentary described the current range as an accumulation zone. However, he kept capital available if the market weakened further.
The price of bitcoin therefore remained pinned below nearby resistance. That structure left $65,000 as the first recovery level traders monitored.
CME Group lists Bitcoin futures, Micro Bitcoin futures, and related options products. Those contracts provide regulated avenues for hedging and directional exposure.
The exchange said its cryptocurrency suite trades continuously through the week. That access keeps derivatives pricing active during spot-market volatility.
Bitcoin Price Structure Keeps $61,000 and $57,000 in Focus
Killa identified a heavy liquidation area around $61,000 below spot price. He said losing that zone could expose liquidity below the $57,000 region.
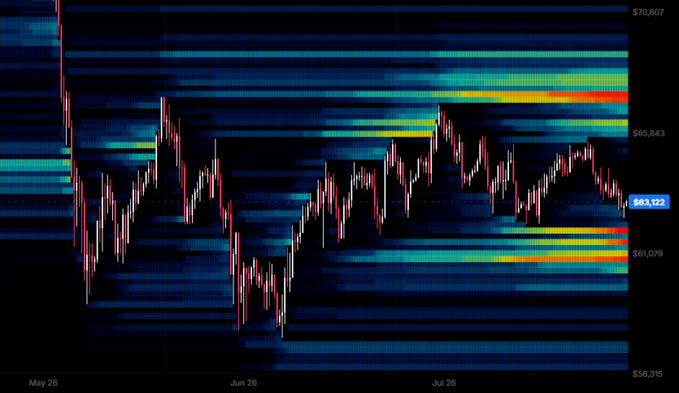
His assessment followed earlier observations that Bitcoin traded between competing liquidation clusters. That structure can amplify volatility when leveraged positions unwind near concentrated levels.
The TradingView chart supplied for this analysis showed Bitcoin near $62,818. It also placed horizontal support around $59,595 after July’s rebound from roughly $57,735.
That chart kept price beneath longer-term moving-average resistance. The broader structure therefore remained weaker while Bitcoin stayed under the low-$70,000 region.
Analysis of those levels suggested sellers retained control below nearby resistance. A clean break under $61,000 would shift attention toward June and July lows.
Daan Crypto Trades separately identified $64,000 as an important short-term pivot earlier this week. He argued bears gained control if price remained below that threshold.
That observation matched Bitcoin’s failure to regain higher resistance. It also narrowed the immediate decision zone before another directional move.
Bitcoin Price Compression Signals a Larger Move Ahead
SuperBitcoinBro said a two-day Bollinger Band squeeze had narrowed around Bitcoin. He placed confirmation thresholds near $66,000 above and $62,000 below.
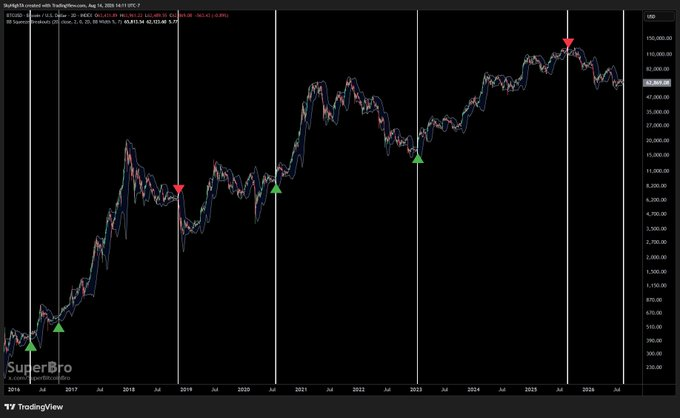
Bollinger Band compression reflects falling realized volatility rather than directional certainty. Traders typically watch the subsequent range break for confirmation.
CME Group data also showed regulated futures trading close to spot prices. Its Aug. 14 quote reinforced the narrow pricing range visible across the market.
The combination left bitcoin price today trapped between resistance and liquidation support. Neither bulls nor bears had established a confirmed directional breakout.
SuperBitcoinBro argued his historical squeeze signals had preceded major Bitcoin moves. However, that claim represents his own backtested observation, not an exchange statistic.
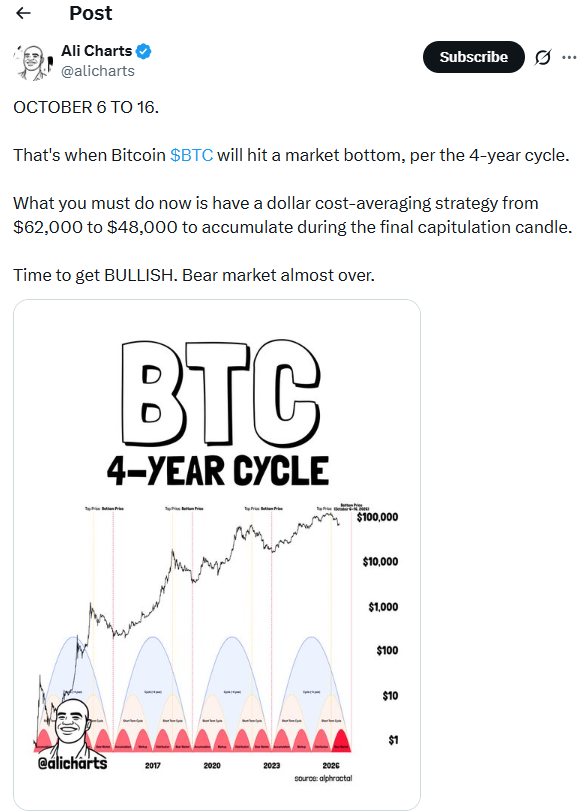
Ali Charts took a longer-cycle view and pointed toward October. He projected a potential market bottom between Oct. 6 and Oct. 16.
He based that projection on Bitcoin’s four-year cycle framework. He also outlined a dollar-cost averaging range between $62,000 and $48,000.
That forecast remains an analyst projection rather than a confirmed market event. Historical cycle timing does not guarantee another bottom inside the same calendar window.
Next Bitcoin Price Levels Center on $62,000 and $66,000
The near-term setup now depends on Bitcoin holding the lower compression boundary. SuperBitcoinBro placed that level around $62,000 on the two-day chart.
A sustained close above roughly $66,000 would instead signal upside expansion. That move would also challenge the repeated rejection zone identified by Daan Crypto Trades.
Below the range, Killa’s $61,000 liquidation area remains the next test. Losing it could direct price toward the high-$57,000 region.
The supplied TradingView chart also showed deeper support near $59,595. That level sat above July’s local low and remained relevant for downside structure.
Ali Charts’ October window remains the next dated market thesis in this group. Traders can verify that projection against price action from Oct. 6 onward.