Boomer
 hi
hi Claudia
 Covenant x402
 Pearl
Pearl Quantus
 Bitcoin

Solana price remains near the $100 level after retreating from its latest high above $110, but several market and network indicators continue showing strength.
SOL fell about 8.3% from approximately $110.50 on Aug. 26 to around $100.40 in the latest dataset cited by analyst Ali Martinez. At the same time, exchange balances declined, network-address creation remained elevated, and U.S. spot Solana ETFs recorded their strongest weekly inflows since launch.
Martinez has identified $150 as a potential upside scenario if Solana begins another expansion phase. That target remains conditional on SOL defending nearby support and clearing several large cost-basis resistance zones first.
Solana Price Pullback Meets Falling Exchange Supply
The recent decline has returned SOL toward the $100 area after buyers failed to maintain the move above $110. This level now sits near the first major resistance zone for another recovery attempt.
A sustained move above $110.50 would restore the recent breakout structure and could create room for higher resistance levels. Until that happens, Solana remains within a consolidation phase following the latest advance.
Exchange data adds another element to the current Solana price analysis because available trading supply has declined. Around 2.6 million SOL reportedly moved off exchanges during the past seven days.
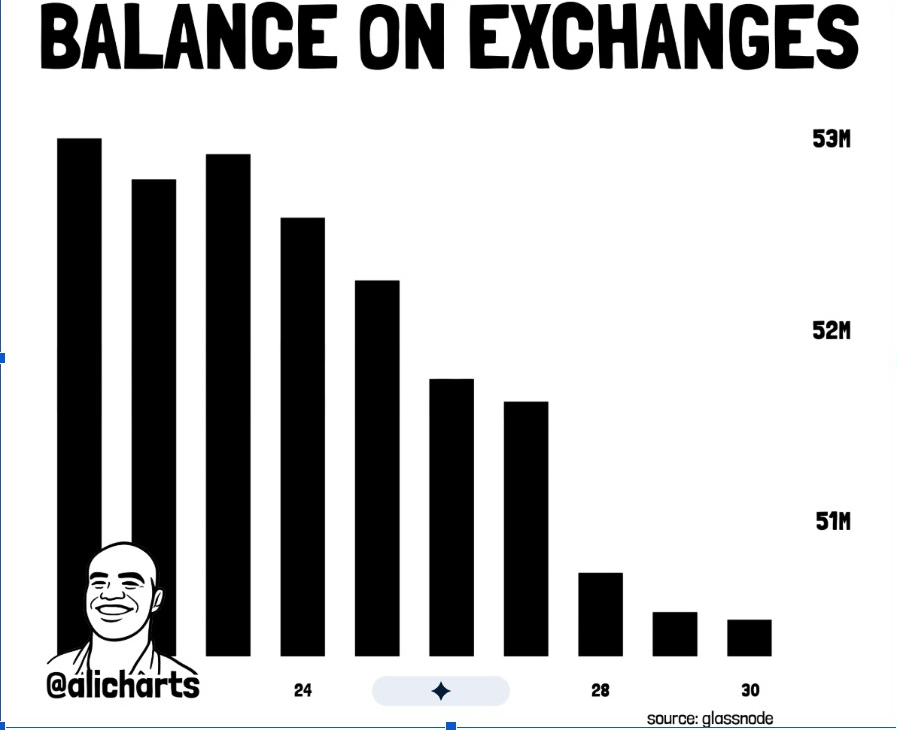
Lower exchange balances can reduce immediately available sell-side supply when tokens move into self-custody or other uses. However, withdrawals alone do not establish whether those tokens will remain off exchanges.
Solana On-Chain Data Shows Network and Whale Growth
Network activity has remained elevated despite the recent price correction. Solana averaged about 9.5 million new addresses per day during the past week.
The number of wallets holding at least 10,000 SOL also increased by 1.58% during the same period. Data cited by Martinez showed 52 additional wallets entering that large-holder category.
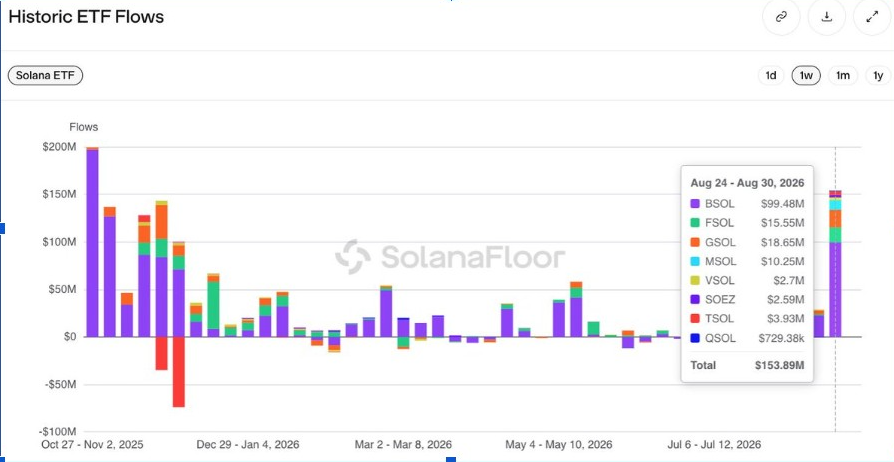
ETF demand has also remained active, with U.S. spot Solana products recording seven consecutive weeks of net inflows. According to SolanaFloor, weekly net inflows exceeded $153 million, marking the strongest weekly total of 2026.
Concurrently, Solana has also ranked first among blockchains for real-world asset net inflows during the past 30 days. That adds another source of network activity beyond conventional crypto trading.
Double Disinflation Vote Reduces Future SOL Issuance
Solana validators have approved SGP-0002, known as the Double Disinflation proposal, by a narrow margin. Support reached 67%, slightly above the required 66.667% threshold.
The proposal raises Solana’s annual disinflation rate from 15% to 30% while retaining a long-term inflation target of 1.5%. Under the revised path, the network would reach that target in approximately 2.8 years.
The previous schedule projected about 5.7 years before reaching the same inflation floor. The new trajectory would therefore move that point toward early 2029 instead of 2032.
Projected SOL issuance would decline by approximately 18.9 million tokens across the next six years under the approved framework. However, the vote does not trigger an immediate change in protocol.
Technical implementation remains tied to SIMD-0550, which still requires development and activation through a future network update. Validator participation reached 60.7% among 1,326 eligible operators during the vote.
Solana Price Holds Near $100 After Recent Pullback
SOL has moved back toward $100.40 after reaching $110.50 earlier in the week. The decline has slowed near a key psychological level, and traders are watching whether buyers defend it.
The short-term Solana price trend remains mixed because the token has not yet recovered its recent high. A move back above $110 would improve momentum and reopen the path toward higher resistance.
According to crypto analyst Ali Charts, Solana’s price has formed a major support zone near $103, where about 39 million SOL were previously acquired. Holding that level could help preserve the current recovery structure.
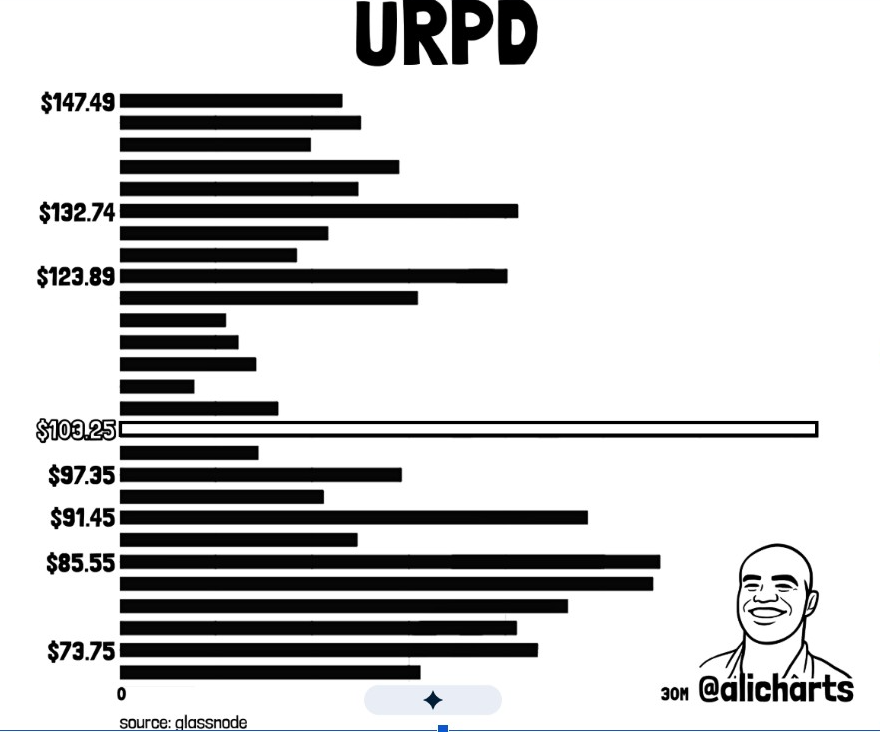
On the upside, the main resistance zones sit near $123 and $132. Around 20 million SOL were acquired at each level. Therefore, SOL crypto breaking above both zones could reduce overhead supply and open a path toward $150.
On the downside, a break below $100 could expose support near $95. Deeper weakness could then shift attention toward the $90 area, where buyers previously showed interest.
This article is for informational purposes only and does not constitute financial advice. Cryptocurrency markets can experience sharp price movements.