
 WASTED
 Official Trump
 Chunkee The Manatee
 Lucia
 Bitcoin
 Pearl
 Pudgy Penguins


Bitcoin price fell below $62,000 on Nov. 19 as U.S. spot Bitcoin exchange-traded funds (ETFs) recorded $582.19 million in net outflows. BTC traded near $61,854 during the downturn after touching approximately $61,290.
The withdrawals extended Bitcoin ETFs‘ losing streak to three consecutive trading sessions, bringing combined outflows to roughly $1.13 billion.
Ethereum ETFs also faced selling pressure, recording $131.24 million in net withdrawals during the same session.
Bitcoin Price Drops Below $62K as ETF Outflows Deepen
The drop below $62K follows a steady slide that started near the $70,000 to $75,000 range. Since then, BTC has printed a series of lower highs and lower lows, and the most recent leg took price from roughly $65,000 down to the $61,000 area in just a few sessions.
ETF flows have closely tracked that price drop. Spot Bitcoin funds posted $1.28 billion in weekly outflows for the week ending November 6 and another $1.07 billion for the week ending November 13.
The week ending November 19 added $1.12 billion in net redemptions, bringing three-week losses to roughly $3.47 billion.
With institutional demand fading, the Bitcoin price has had little support from the buyers who drove much of its earlier rally.
BTC ETFs Record $582M Outflow as Losses Stretch to Three Days
SoSoValue data shows BTC ETFs lost $239.94 million on November 17 and $306.42 million on November 18 before the $582.19 million exit on November 19.
That adds up to about $1.13 billion in three trading days. The only break in the trend came on November 16, when the funds pulled in a modest $7.99 million.
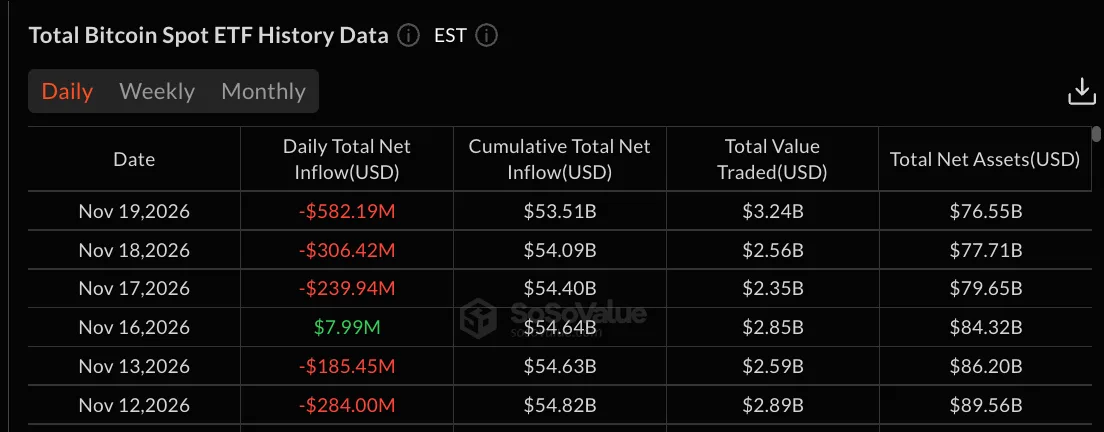
Cumulative net inflows across all spot Bitcoin ETFs now stand at $53.51 billion, down from $54.82 billion on November 12.
Total net assets fell harder, from $89.56 billion to $76.55 billion over the same period, since falling prices cut the value of existing holdings on top of the redemptions.
Ethereum ETFs Lose $131M as Selling Pressure Grows
Ethereum funds are seeing the same trend on a smaller scale. Spot ETH ETFs recorded $131.24 million in net outflows on November 19, following exits of $39.83 million, $29.09 million and $8.31 million over the prior three sessions.
Total net assets in Ethereum ETFs dropped to $9.60 billion from $10.85 billion on November 13, while cumulative net inflows slipped to $11.31 billion. Daily traded value rose to $624.60 million, again the highest level of the week.
When Bitcoin and Ether funds bleed capital at the same time, it usually points to a broad risk-off mood among institutional investors.
Bitcoin Price Analysis: Can BTC Reclaim $62K?
On the 1-hour chart, the structure stays bearish. BTC is sitting close to its recent low, and buyers have yet to put together a convincing reversal.
The zone between $61,300 and $62,000 is the area to watch. BTC has tested $62K several times, and the latest wick reached about $61,290.
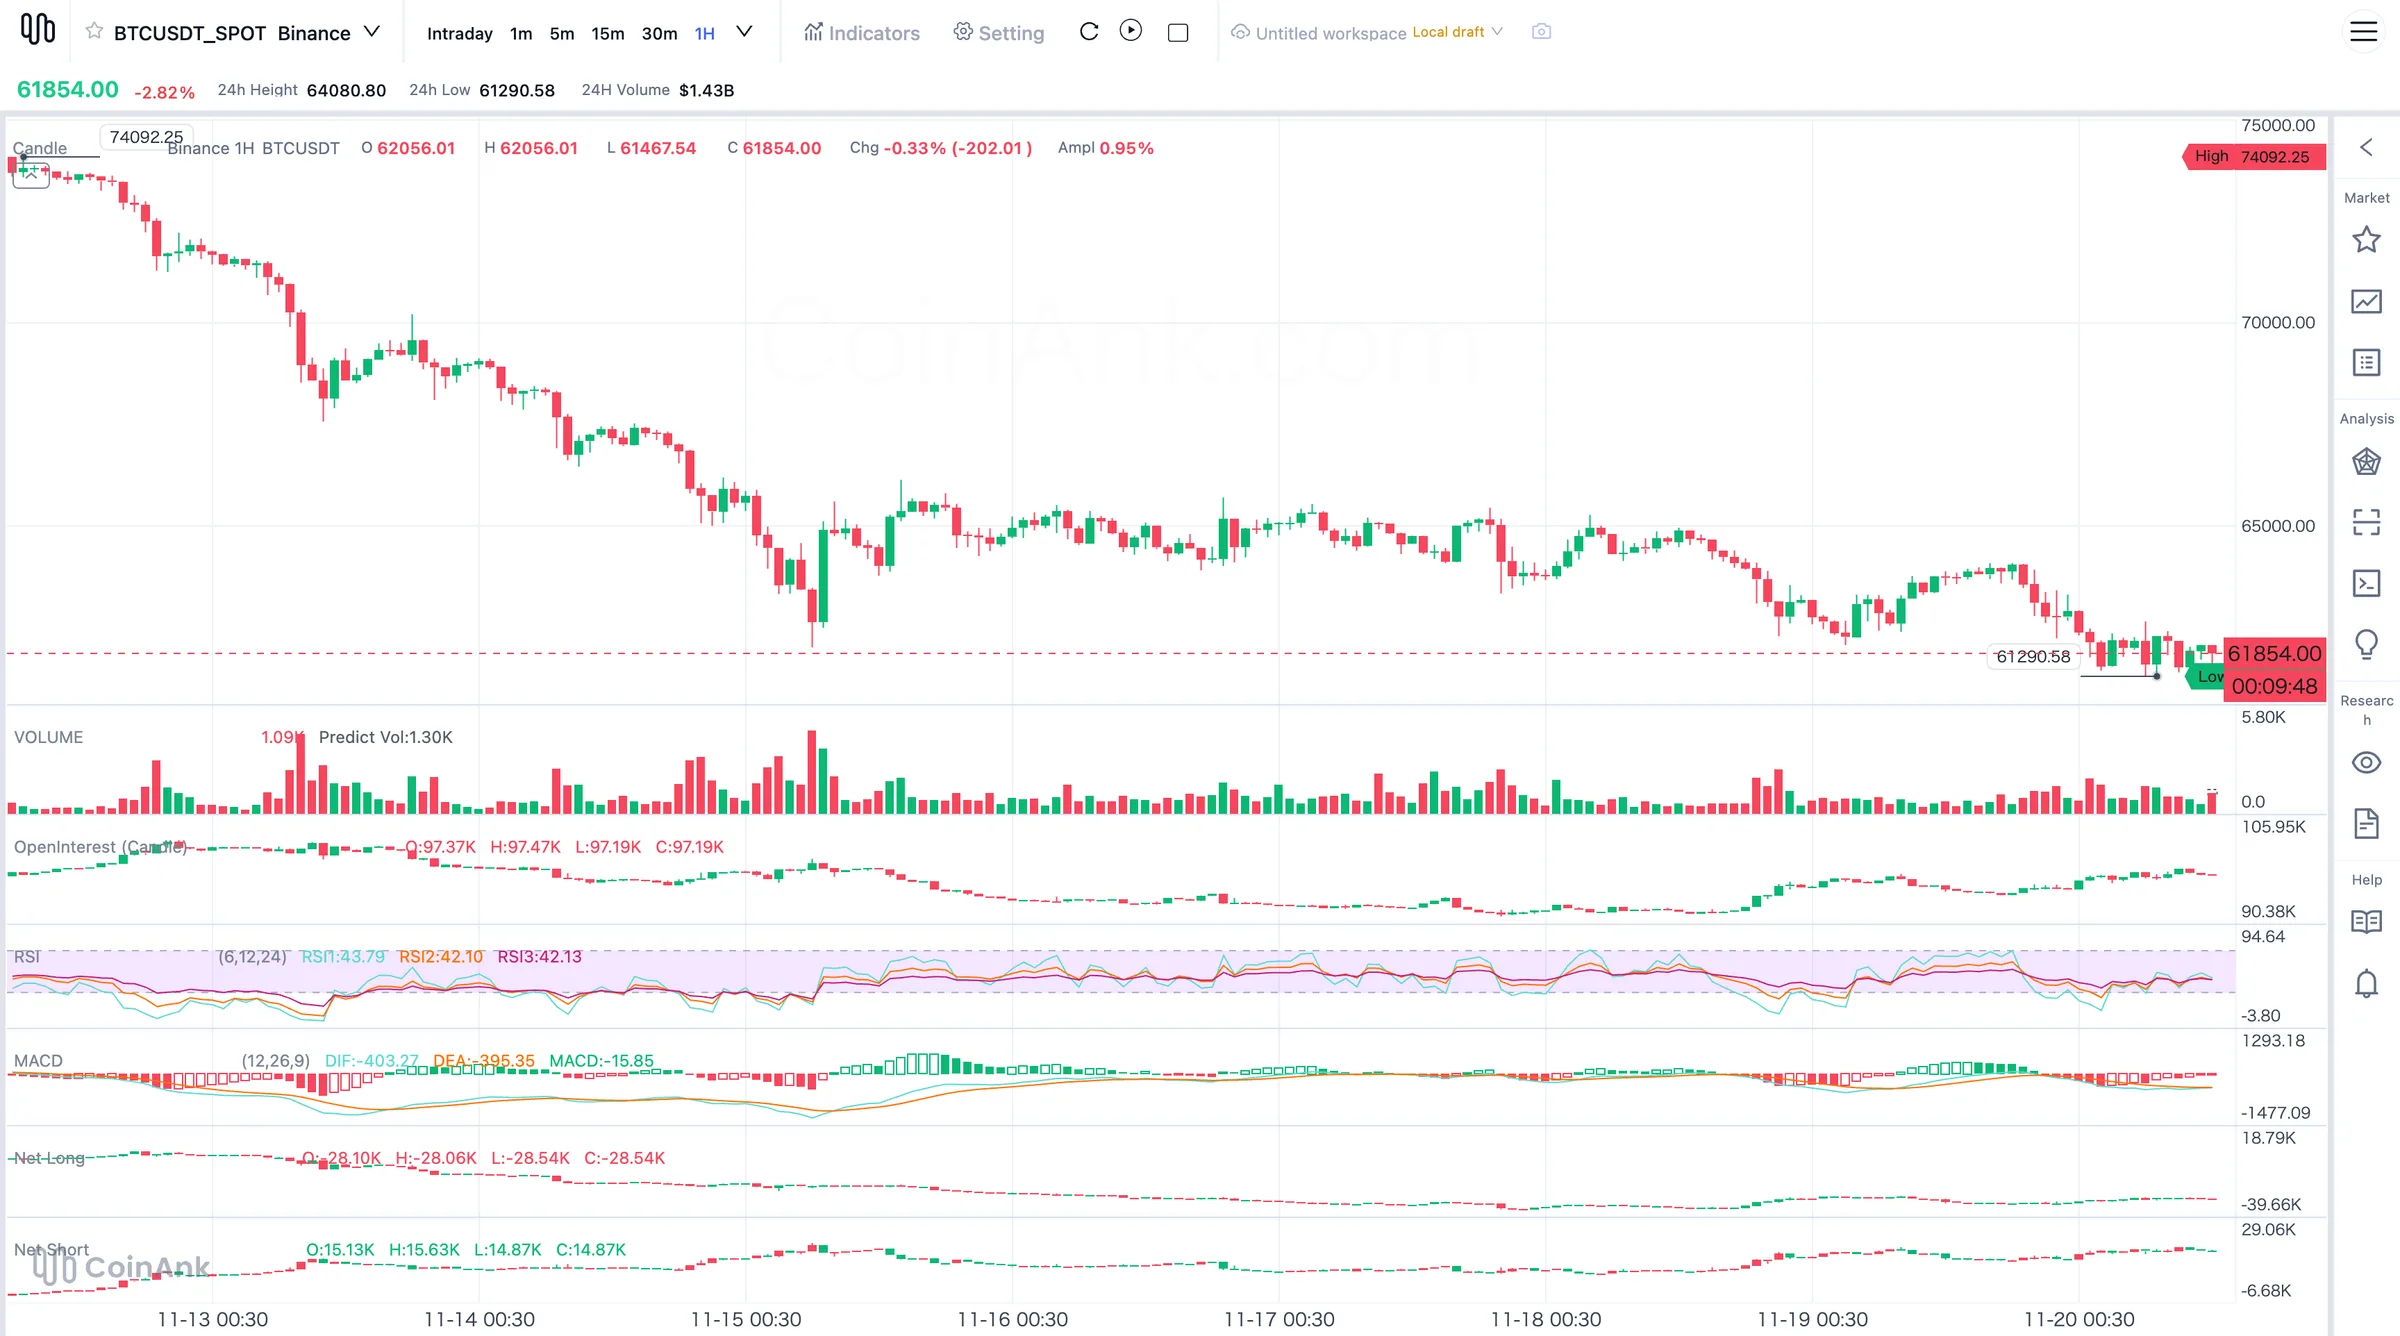
A stable break below $61,300 would pull it another leg lower, with $60,000 standing out as the next psychological target.
On the upside, the first hurdle sits between $62,500 and $63,000. A move above $63,500 would put the Bitcoin price into its first meaningful recovery zone, while $64,500 to $65,000 is the major resistance left over from the previous consolidation.
For now, the short-term bias stays bearish. If the Bitcoin price holds $61,300, a relief bounce toward $63,000 to $63,500 is possible. Losing that level would put $60,000 in play.
This article provides financial information and market analysis, not investment advice. Cryptocurrency prices remain volatile, and technical forecasts do not guarantee future performance.