
 astronaut
 Pearl
Pearl Hyperliquid
 Walrus
 Pudgy Penguins
 Bitcoin
 NEAR Protocol

Key Insights:
- Bitcoin’s IFP turns negative as traders shift funds from derivatives, signaling risk aversion.
- On-chain metrics show declining activity, with fewer new addresses and lower transaction volume.
- FTX repayments may add volatility, with $18B expected to flow into crypto, impacting liquidity.
The crypto market is experiencing turbulence as leading digital assets face downward pressure. Bitcoin (BTC) price recently dropped to approximately $96,000, reflecting the broader decline.
The bearish momentum intensified at the beginning of the business week, briefly pushing BTC down to $95,800 before a modest rebound to around $96,092.
The Inter-Exchange Flow Pulse for Bitcoin has turned negative, which indicates upcoming bearish market conditions.
CryptoQuant’s Bitcoin exchange flow statistics highlights this critical measure, which tracks Bitcoin spot-market and derivatives transaction volumes. The shift suggests traders may be reducing exposure to risk, prompting concerns about declining market momentum.
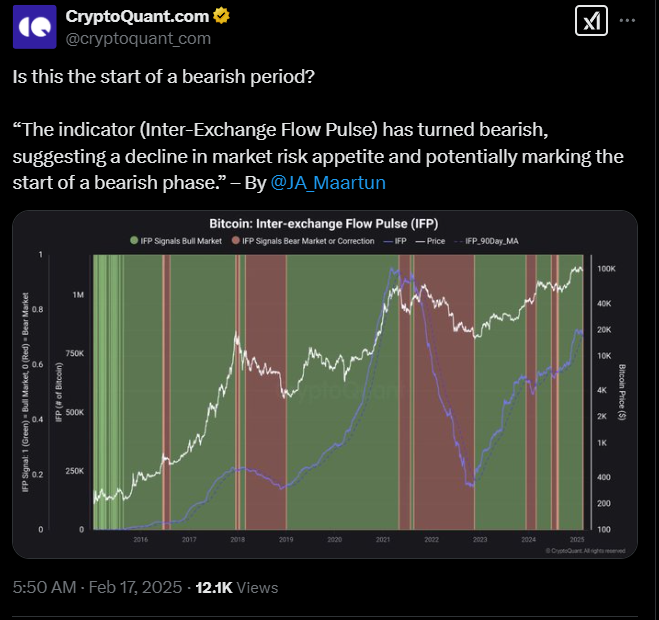
Bitcoin Exchange Flow Signals Bearish Trend
Using the IFP, users can gain information about Bitcoin price changes stemming from exchange transaction patterns. The shift of substantial Bitcoin holdings towards derivative exchanges commonly triggers trader preparations for long positions, which indicates positive market expectations.
Spot market transactions involving Bitcoin flows from derivative exchanges reveal that traders are closing their long positions and indicating lower market risk tolerance.
Currently, the IFP shows negative values, indicating that traders tend to remove their assets from derivative trading platforms. The movement signals market expectations for decreasing prices since it occurs during lowered speculative enthusiasm. Bitcoin price corrections have the potential to occur with decreased leveraged positions.
Daily Active Addresses From IntoTheBlock
Data from IntoTheBlock reveals additional insights into Bitcoin’s network activity, highlighting notable changes over the past seven days. The number of New Addresses (NA) has declined by 8.43%, indicating a slowdown in user adoption.

A 6.22% drop in Active Addresses (AA) further supports this trend, suggesting reduced transaction volume.
Meanwhile, Zero Balance Addresses (ZBA) have decreased by 11.30%, implying that fewer wallets are being emptied. This could indicate increased holding behavior among existing investors. These on-chain metrics, combined with declining exchange inflows, reflect a cooling market environment.
Bitcoin Price Technical Indicators Highlight Market Weakness
Further, technical analysis from TradingView provides additional context on Bitcoin price action. The Relative Strength Index (RSI) currently stands at 44.07, with a downward slope, indicating weakening momentum.

Current RSI readings show declining movements from its overbought position in January, maintaining a bearish reading. The current RSI value stands above 30, indicating that Bitcoin price has not reached the oversold zone.
The Accumulation/Distribution (A/D) indicator approaches the situation from a different analytical standpoint. The Accumulation/Distribution indicator indicates that investors maintain a measured trend of Bitcoin acquisition despite price stability. When A/D halts from its upward trend, it could suggest increased selling that would fuel more market declines.
Market Liquidity Impacts
Meanwhile, FTX repayments set to commence tomorrow may introduce further volatility. It is estimated that about $18 billion will be invested in Bitcoin and other cryptocurrencies in the process, distorting the liquidity levels.

On the bearish side, the threshold of capital expected to digital funds can result in exchange inflows and possibly induce fresh selling pressure.
Institutional players may prefer to transact through the use of OTC to avoid such disruptions in the price. There may also be a rise in the derivatives volume, where traders short Bitcoin in the hope for price change.
Disclaimer
In this article, the views, and opinions stated by the author, or any people named are for informational purposes only, and they don’t establish the investment, financial, or any other advice. Trading or investing in cryptocurrency assets comes with a risk of financial loss.




