astronaut
 Pearl
Pearl Zylo Ecosystem
 Bitcoin
 Bitway
 NEAR Protocol
 Zcash
Zcash

Key Insights:
- Bitcoin trades within a falling wedge, signaling a possible bullish reversal if resistance breaks.
- Analysts highlight key support levels, with a breakdown risking further downside in the coming weeks.
- Whale accumulation has increased, though market prices have yet to react to recent buying activity.
Bitcoin price has experienced significant fluctuations in recent days, with sharp declines followed by attempts at recovery. After consolidating around $86,000 over the weekend, the asset faced renewed downward pressure at the start of the business week. A sudden drop brought BTC to $80,000, triggering multi-million-dollar liquidations within 24 hours.
However, the crypto rebounded, climbing back near $84,000, according to CoinGecko. With the BTC price at $82,570, analysts have highlighted key technical patterns that could determine Bitcoin’s next move, with both bullish and bearish scenarios in play.
Potential Reversal for Bitcoin Price
A technical analysis by Captain Faibik outlines Bitcoin’s price action within a falling wedge pattern on the daily timeframe. This formation, characterized by converging trend lines with lower highs and lower lows, often signals a potential bullish reversal. The asset recently touched the lower boundary of this wedge, which has historically provided strong support.
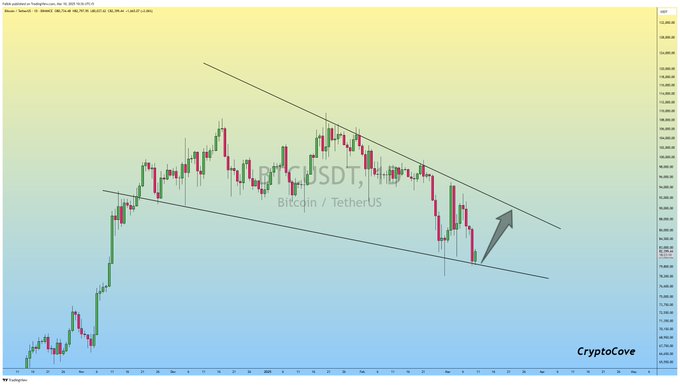
Bitcoin’s ability to hold this support level suggests decreasing selling pressure and a possible momentum shift. The upper descending trendline currently acts as resistance, with the next key level around $90,000. A breakout above this trendline could indicate a strong upward move.
Meanwhile, another analysis by Captain Faibik on Bitcoin Futures (BTC1!) presents a rising wedge pattern on the weekly timeframe. This pattern, which can lead to either a continuation or a breakdown, shows BTC trading near a crucial support zone. The asset is testing the lower boundary of the wedge, making it a pivotal point for determining future direction.
Bitcoin Price Key Support and Resistance Levels Identified
Captain Faibik points to the 50-week moving average (MA50) at $76,000 as a critical support level. A weekly close below this level could shift momentum in favor of the bears, potentially leading to a deeper correction. If BTC fails to maintain support at this level, the next major support zone lies between $50,000 and $55,000, an area that has previously served as a strong base.
On the upside, resistance remains at $120,000, aligning with the upper boundary of the rising wedge. A successful bounce from the support trendline could see Bitcoin testing this level. A breakout beyond $120,000 would reinforce bullish momentum.
Separately, Ali Martinez explores weekly Bitcoin market activity using Stochastic RSI data.
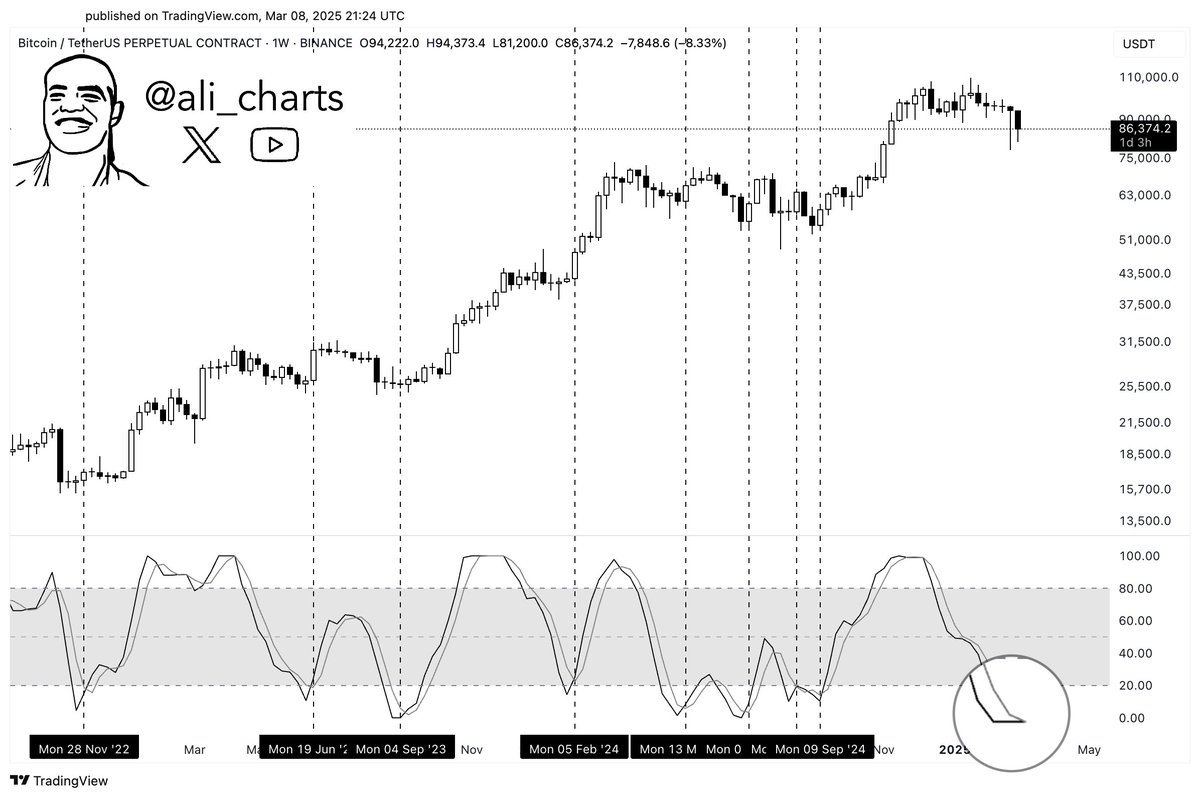
Historical data shows that Bitcoin recovers after price extends too low, and when Stochastic RSI cross events take place in negative territory. The markets have observed crossover patterns before major price hikes numerous times, and a new crossover is forming.
Whale and Shark Wallet Activity Points to BTC Accumulation
Elsewhere, on-chain indicators from Santiment tracking whale movements since the previous six months provide further context. Notably, minor selling pushed market value lower during this period.
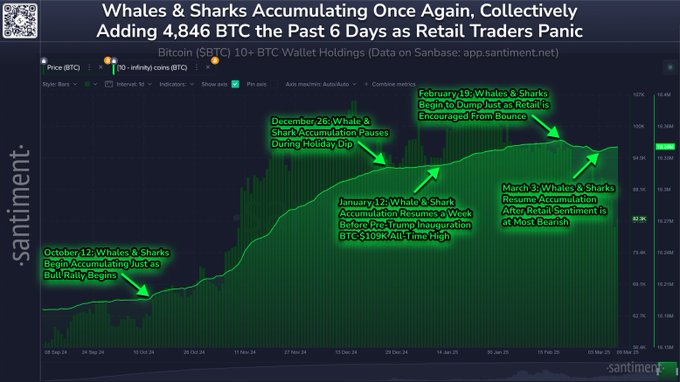
Between March 3 and March 11 the largest Bitcoin accounts have invested almost 5000 BTC into the market.
Whale and shark market buyouts do not create sudden price fluctuations. Santiment strongly believes that market response in March will be positive, because big investors continue buying BTC. Bitcoin market participants remain at a critical time as they decide through their trading habits with key support and resistance levels crucial for next moves.
Disclaimer
In this article, the views and opinions stated by the author or any people named are for informational purposes only, and they don’t establish the investment, financial, or any other advice. Trading or investing in cryptocurrency assets comes with a risk of financial loss.