NEAR Protocol
 Pyth Network
 Uniswap
 Pearl
Pearl Quantus
 Aerodrome Finance
 Starknet

Key Insights:
- Bitcoin’s $69K Spot ETF level remains its most critical support zone.
- Heavy resistance at $87K caps Bitcoin’s short-term breakout potential.
- Macro fears and LPF model point to a $70K downside risk.
Bitcoin price $83K masks deeper risks as macro fears rise. Experts say the $69K Bitcoin Spot ETF level remains the key support to avoid a broader correction.
Bitcoin Price Faces Growing Pressure Beneath the Surface
Bitcoin (BTC) continues to trade above $83,000, but the market’s resilience may be masking growing downside pressure. According to multiple analysts and on-chain signals, the real support to watch is the $69,000 Bitcoin Spot Exchange-Traded Fund (ETF) realized price.
This level, derived from the average acquisition cost of all spot ETF holders, has served as a base during past drawdowns since ETFs launched in Jan. 2024. Despite broader market jitters, Bitcoin has consistently bounced from this line, including during the August 2024 carry trade unwind.
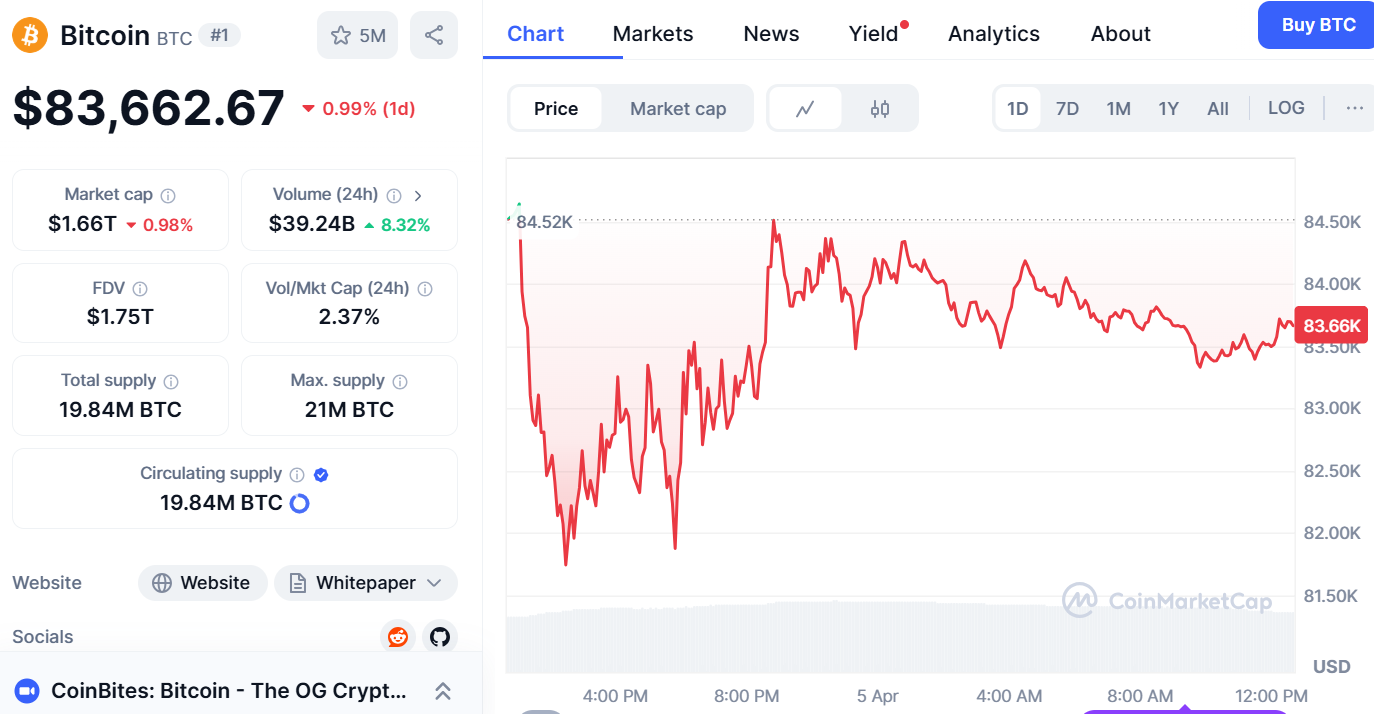
At the time of writing, Bitcoin price traded at $83,662. Yet, as macroeconomic pressures mounted and technical headwinds converged, the $69,000 zone appeared poised for another test.
Spot ETF Buyers Set the Floor—For Now
Independent crypto analyst Darkfost described the Spot ETF realized price as Bitcoin’s most critical support. In a post published earlier today, he argued that Bitcoin has repeatedly respected this threshold across multiple macro shocks.
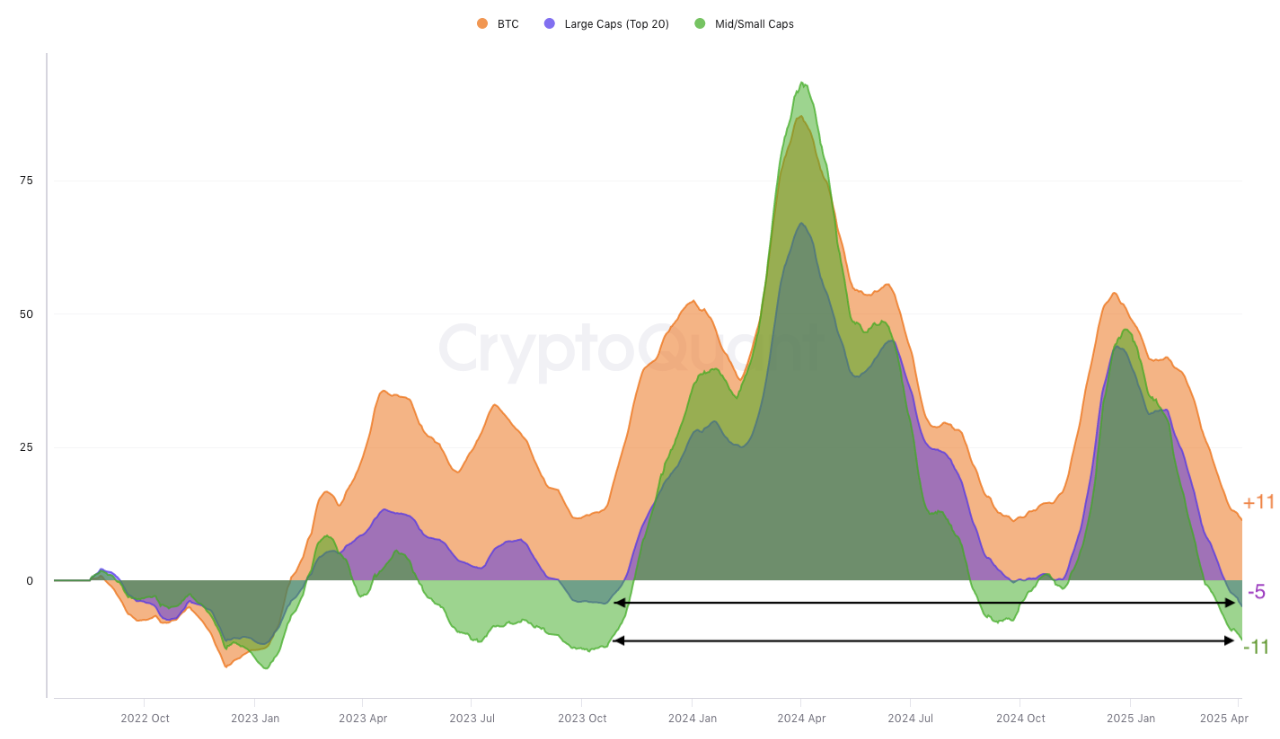
The $69,000 area not only reflects ETF participants’ cost basis but also represents a psychological anchor. Spot ETF demand has helped maintain BTC’s structure even as altcoins weaken. According to a market cap analysis by CryptoQuant, all altcoin categories—large cap, mid, and small—are underperforming Bitcoin.
This divergence signals increased capital concentration into BTC, with ETF-driven flows sustaining the trend.
Heavy Resistance Near $87K Caps Upside
On the technical front, Bitcoin is confronting a multi-layered resistance cluster at $87,000. According to Ali Martinez, this level combines the 50-day and 200-day moving averages with a descending trendline stretching from all-time highs.
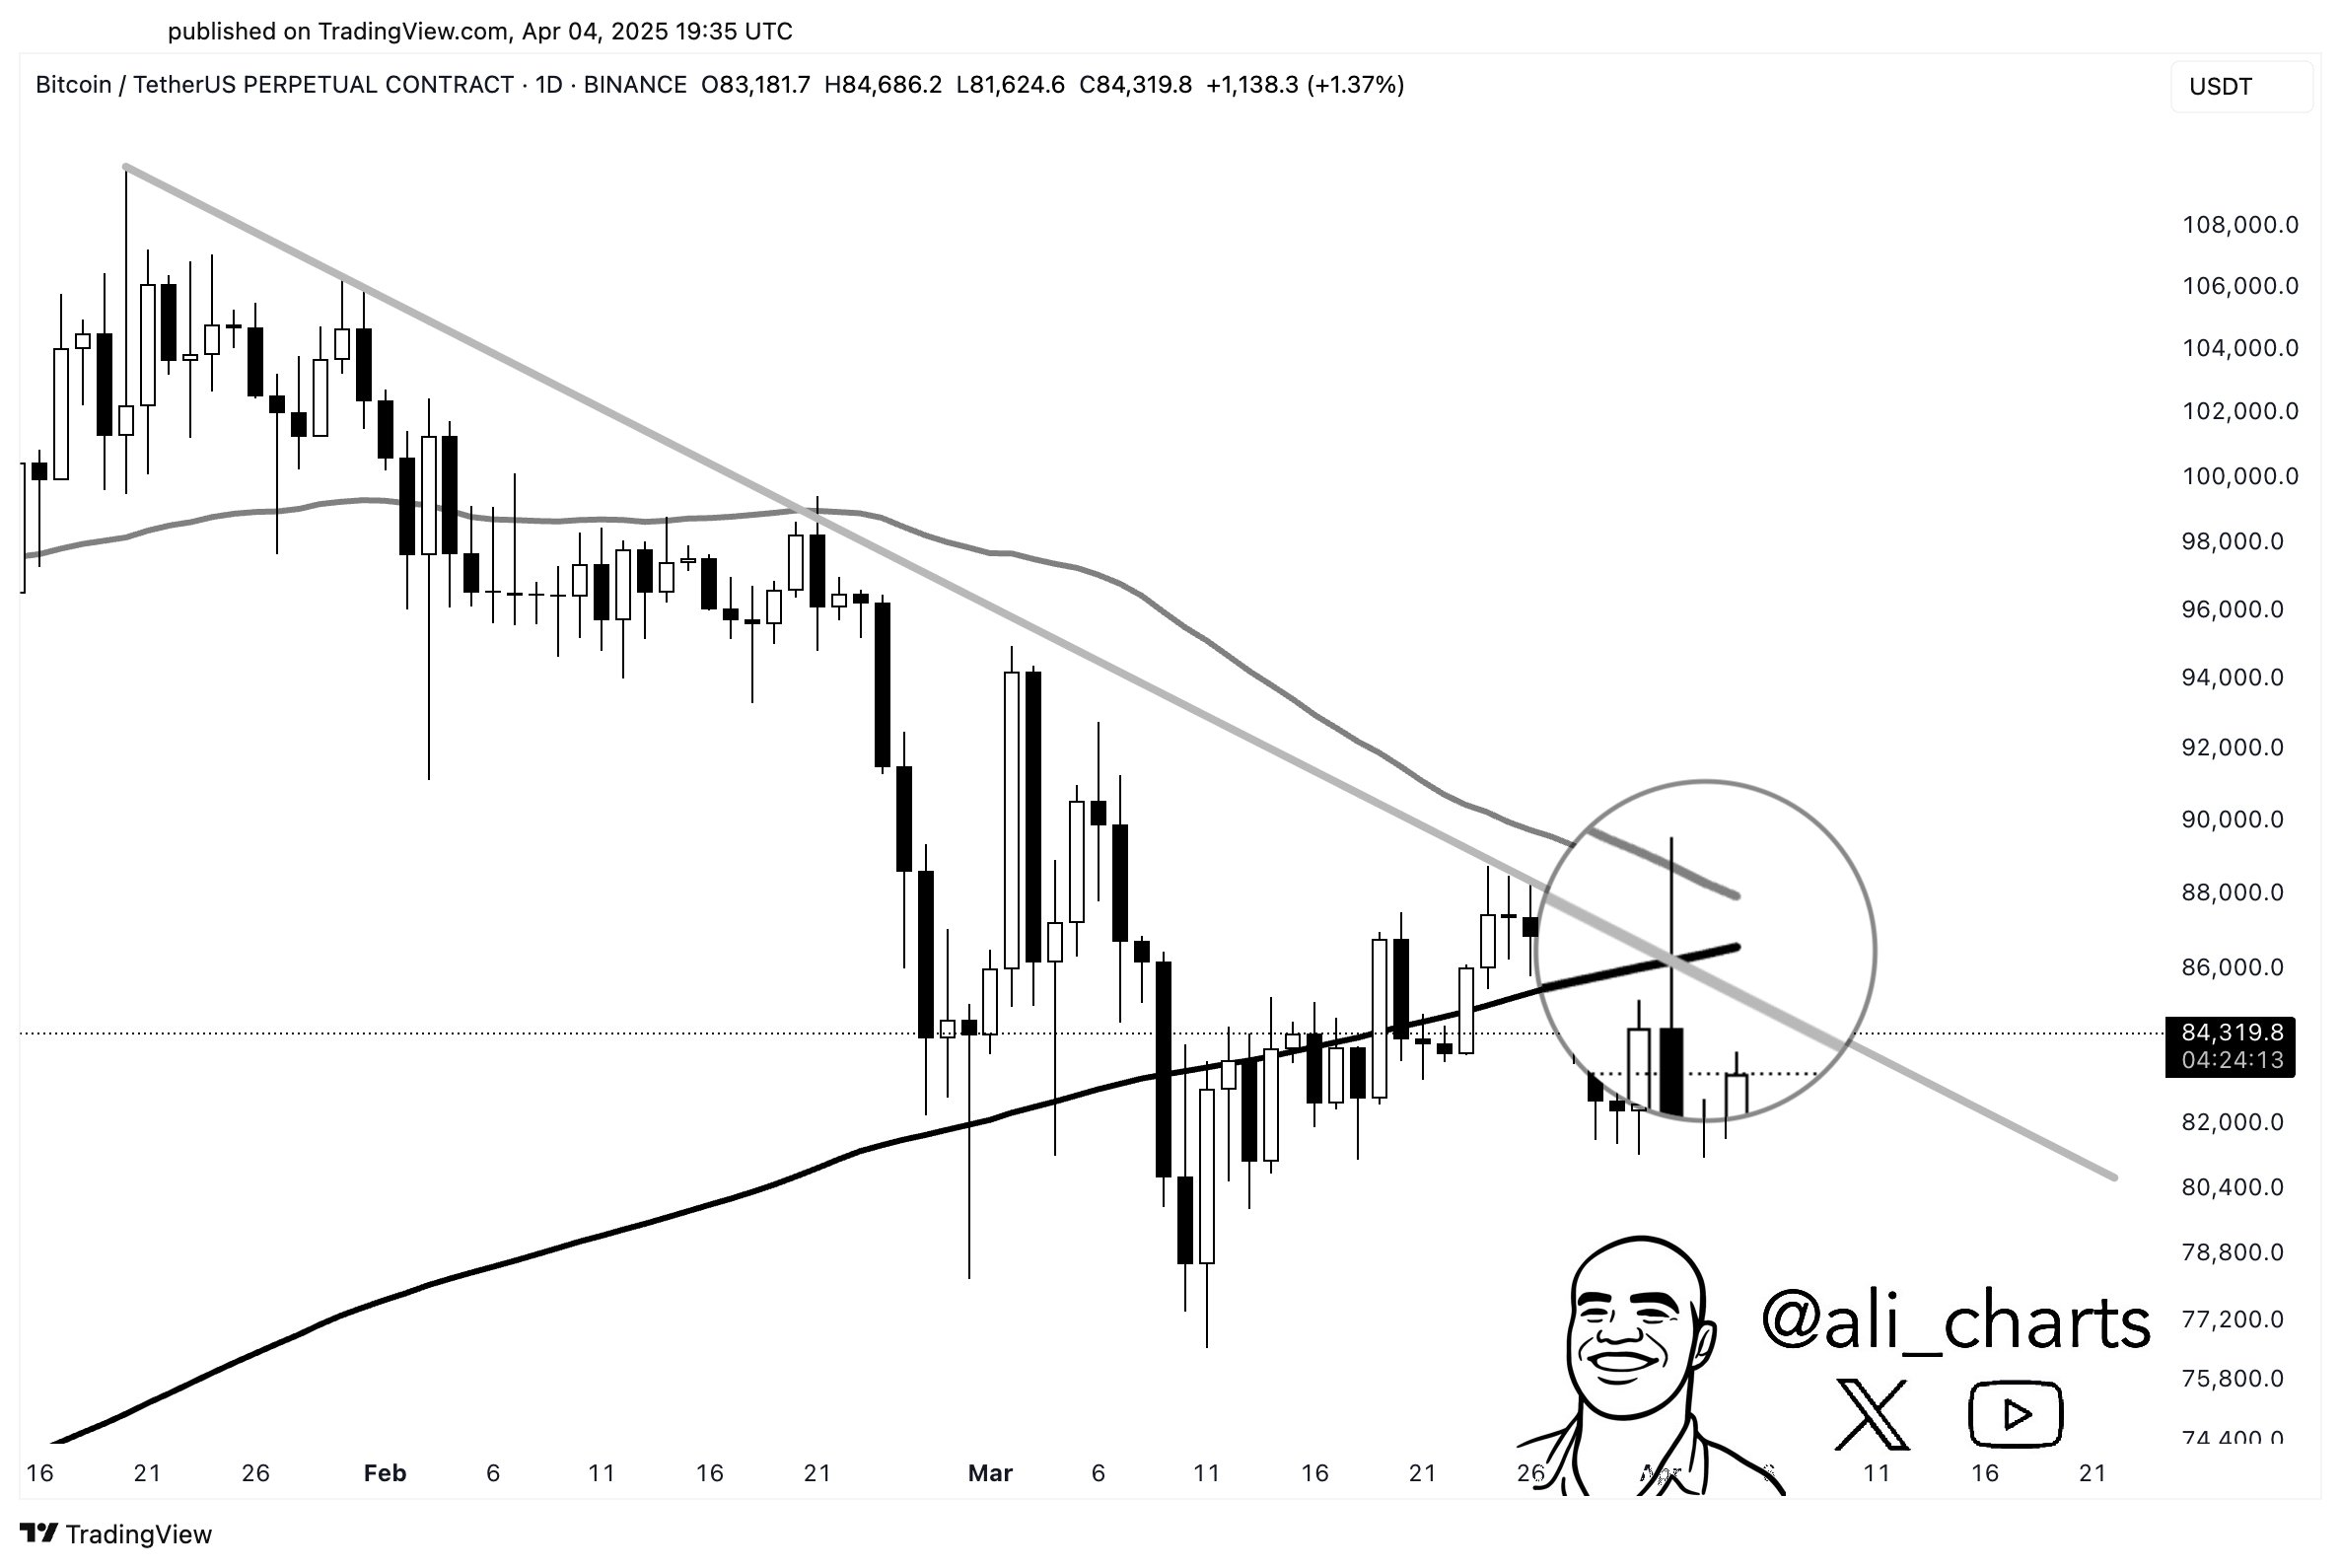
The latest daily chart on TradingView shows Bitcoin attempting to consolidate between $85,467 and $83,000. The RSI indicator remains neutral at 46, leaving room for downside continuation if macro sentiment weakens.
That setup raises the stakes for the $69,000 level. Should Bitcoin break below it, analysts warn of a deeper retracement toward prior cycle highs.
$70K ‘Practical Bottom’ as Macro Fears Resurface
Network economist Timothy Peterson suggested Bitcoin price could slide back to $70,000 in the coming days. In his latest X analysis, Peterson applied his Lowest Price Forward (LPF) metric, which has previously marked BTC bottoms with 95% accuracy.
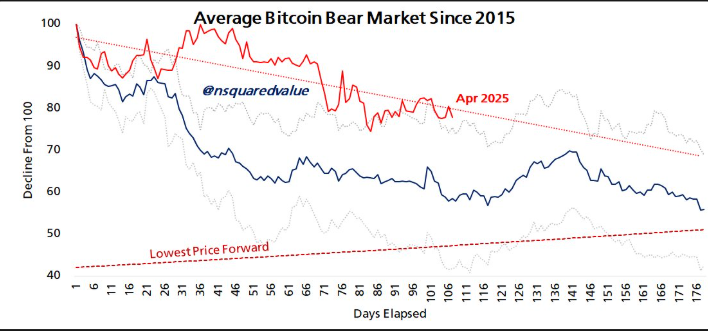
“Bitcoin to $70K in 10 days?” Peterson asked, posting a chart comparing current trends to previous bear markets. He added that this wasn’t a prediction, but rather a data-driven expectation.
Peterson’s model successfully identified a $10,000 price floor in 2020. He now warns that elevated U.S. tariffs and broader economic uncertainty could weigh heavily on risk assets, including Bitcoin.
Options Skew Hints at Elevated Fear
Glassnode data confirms the market’s fragile mood. In an X thread on Apr. 4, the analytics firm reported that traders were paying premiums for downside protection.
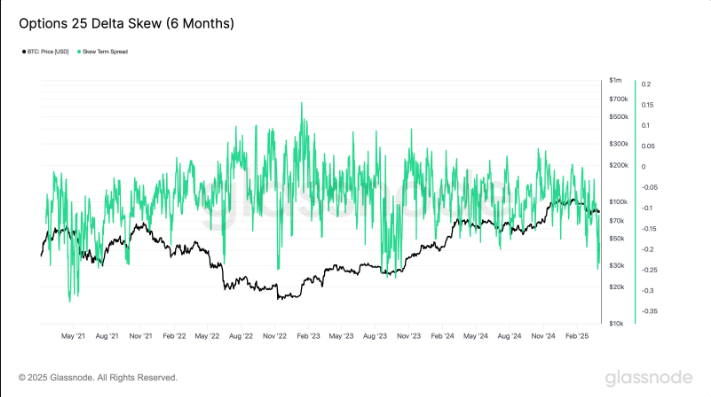
Despite that, Glassnode noted that Bitcoin has yet to mirror equity market capitulation. Stocks dropped on recent U.S. tariff headlines, but Bitcoin has held relatively steady. This divergence adds to the perception that $69K is more than just a support—it’s the last bastion against capitulation.
Bitcoin’s $83K price action hides a more fragile support structure beneath. As macroeconomic risks intensify and technical resistance tightens, attention now turns to the $69K Bitcoin Spot ETF realized price.
Should Bitcoin price break below this level, a flush toward $70K becomes increasingly probable, aligning with LPF historical models and growing fear in the options market.
Disclaimer
In this article, the views and opinions stated by the author or any people named are for informational purposes only. And they don’t establish the investment, financial, or any other advice. Trading or investing in cryptocurrency assets comes with a risk of financial loss.