Quantus
 Injective
 Bitcoin
 Quant
Quant Pudgy Penguins
 Raydium
 Bittensor
Key Insights:
- $25.38M in shorts set for liquidation above the $105,244 level.
- Derivatives volume fell as open interest and funding rates rose.
- Market data signals ongoing short squeeze pressure on BTC.
Bitcoin price has been on the rise, attracting significant attention. It recently surged past the $104,000 mark, reinforcing its upward momentum.
Over the past 30 days, it has posted a 24.5% increase, with a 10.2% gain in the last week. Despite a slight 0.2% dip in the past hour, the 24-hour movement remains positive at +1.8%.
Over one year, Bitcoin price has gained 65.7%, underscoring a sustained uptrend. Derivatives data and liquidation trends reveal growing pressure on short positions. This indicates a more profound market shift beyond just a price recovery.
Bitcoin Price Nears Key Liquidation Zone, Raising Short Squeeze Risks
Ali Martinez released a Coinglass liquidation heatmap that tracked BTC/USDT transactions on Binance between May 11 and May 13, 2025. This tool reveals where high-leverage positions face potential liquidation based on price action.
The most notable cluster appears just above the $105,000 level. On May 13 at 20:15, Bitcoin price reached $105,244.2. At that point, approximately $25.38 Million in short positions were at risk of being liquidated if Bitcoin continued higher.
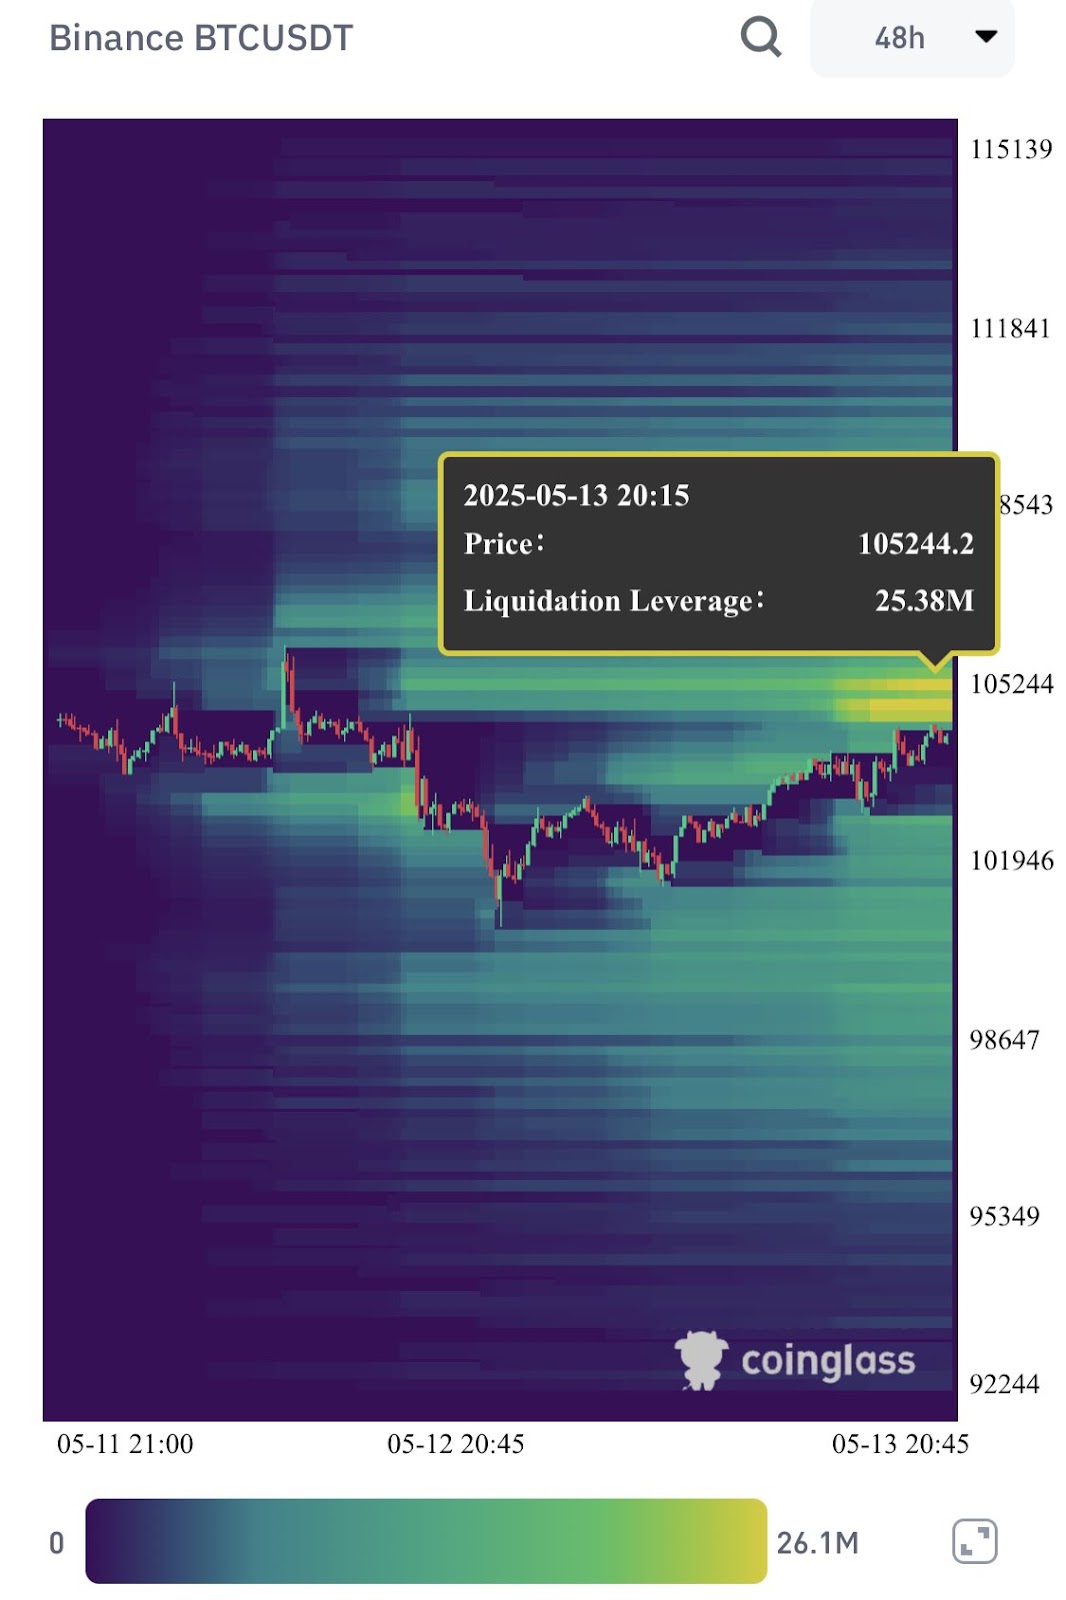
The bright yellow heat area on the chart highlights a potential liquidation zone. It signals increased risk for short traders in the current market conditions. Price data during this period shows an upward trend beginning from a local low of around $98,647.
As the market moved closer to $105,000, it entered a zone where many traders had placed high-leverage short positions. These positions reflect an expectation of resistance. However, the consistent climb in price indicated that short positions may now be under significant pressure.
This pressure opens the door for a short squeeze scenario. There, the liquidations force short sellers to buy back into the market. That activity can accelerate the Bitcoin price movement, especially with strong momentum and reduced selling pressure.
Holding Behavior and Decreased Speculative Activity
Meanwhile, additional metrics from the Bitcoin derivatives market show evolving trader behavior. The latest snapshot shows that derivatives trading volume is $97.62 Billion.
This figure marks a 27.07% decrease, suggesting a temporary reduction in activity. Open interest has increased by 1.19% to $67.91 Billion, showing traders’ commitment to their positions. This trend persists despite a decline in overall trade volume.
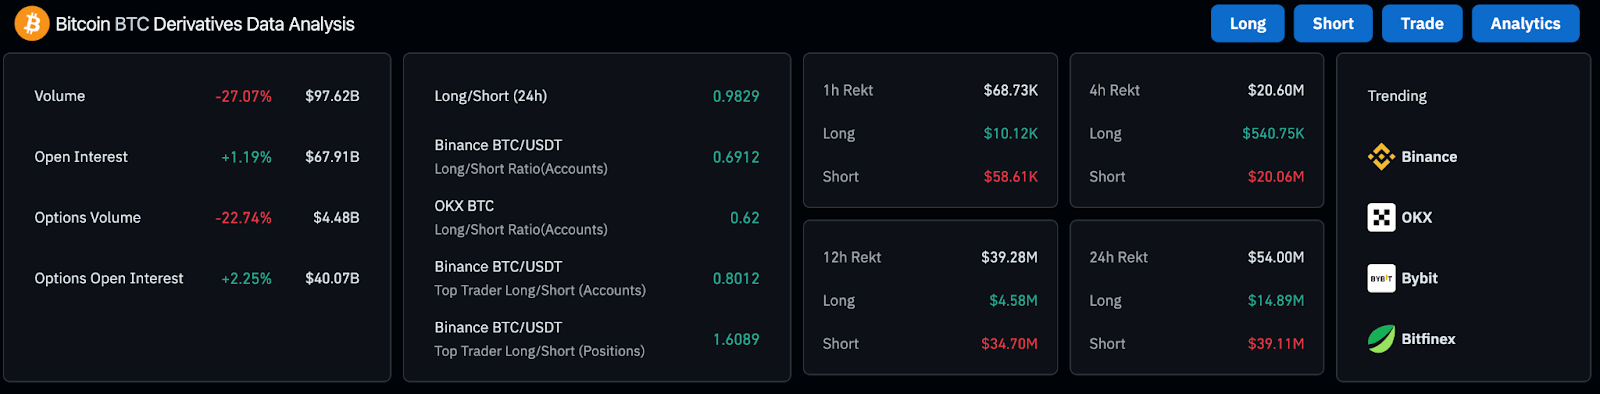
Options trading reflects a similar trend. While BTC options volume has declined by 22.74% to $4.48 Billion, options open interest rose by 2.25% to $40.07 Billion.
This divergence suggests traders maintain current option strategies while initiating fewer new positions. The change reflects a market leaning toward stability and conviction rather than increased speculation.
Sentiment data from long/short ratios further highlights a near-even distribution of market expectations. The 24-hour long/short ratio is 0.9829, showing a slight skew toward short positions.
At the same time, liquidation data continues to point toward pressure building on the short side. Over the last 12 hours, $39.28 Million in positions were liquidated. Notably, $34.70 Million came from short trades, highlighting the intense pressure on bearish positions.
In the past 24 hours, $54 Million was liquidated, with shorts accounting for $39.11 Million. Long positions saw comparatively lower liquidations at $14.89 Million. These figures align with heatmap data, highlighting the increasing vulnerability of short positions as Bitcoin nears key price levels.
Funding Rate Stability Signals Sustained Bitcoin Price Rally
Another source of information is Coinglass’s chart. This shows the BTC OI-Weighted Funding Rate, tracking trader sentiment and market positioning from April 19 through May 13.
This information shows the funding rates from various derivatives and relates them to spot prices. At first, by April 22, most funding rates were negative. Such a pattern suggested that short positions were common whenthe Bitcoin price declined.
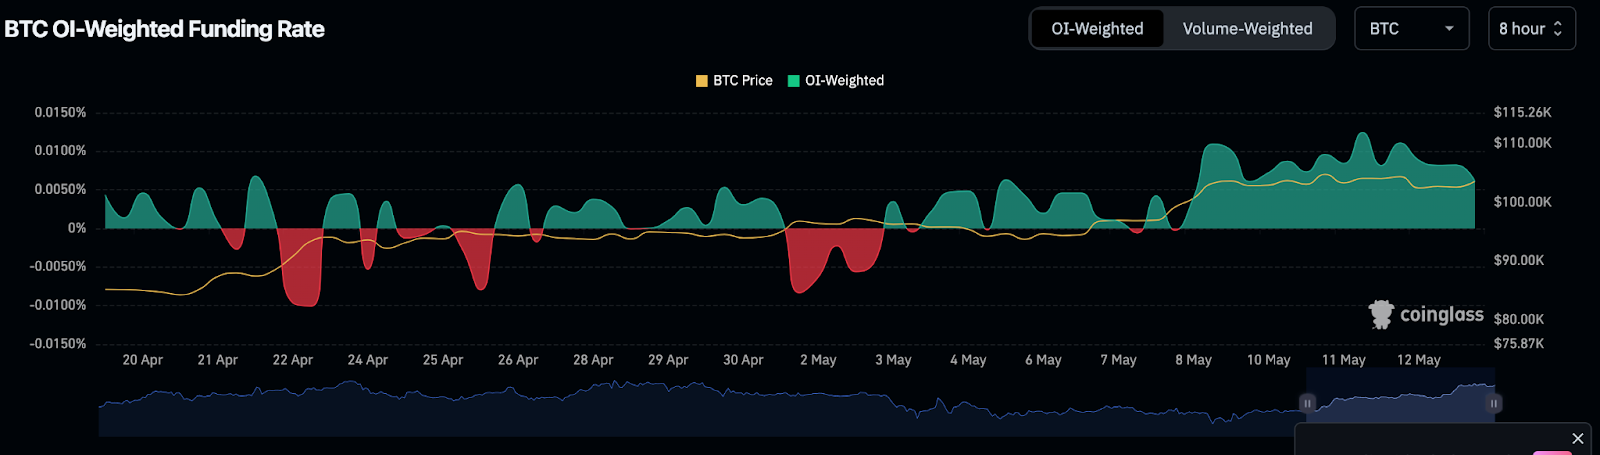
Starting from late April, sentiment changed. As the funding rates became higher, Bitcoin (BTC) price also started to go up. The funding rate reached and remained positive in early May, while Bitcoin exceeded $100,000.
It shows that traders were eager to pay extra for long positions, showing they had regained bullish enthusiasm. Most importantly, the funding rate has stayed flat, which means trading with leverage is still under control.
Because the funding rate is steady, the rally is probably not from speculation but regular buying pressure. Rising open interest and mounting pressure on short positions indicate a market shift. Funding data confirms that the structure has evolved over the past several weeks.
Disclaimer
In this article, the views, and opinions stated by the author, or any people named are for informational purposes only, and they don’t establish the investment, financial, or any other advice. Trading or investing in cryptocurrency assets comes with a risk of financial loss.