Zerebro
 Bitcoin
 Quantus
 Pearl
Pearl Starknet
 ZKsync
 NEAR Protocol

Key Insights:
- Long-term Bitcoin holder supply rises from 14.3M to 15.8M BTC, showing strong holding behavior.
- Short-term traders swing from -19% to +21% profit margin in just one month.
- Bitcoin forms a breakout pattern aiming for a potential target of $116,000.
Long-term Bitcoin holders increased their supply from 14.3 million BTC to 15.8 million. The behavior suggests rising confidence and a reduced appetite to sell. At the same time, short-term traders reentered profit territory as Bitcoin consolidated near its recent highs.
Bitcoin Long-Term Holder Supply Climbs to Record 15.8M BTC
The number of long-term holders (LTHs) of BTC rose to a record 15.8 million. The metric tracks users who have held coins for over six months.
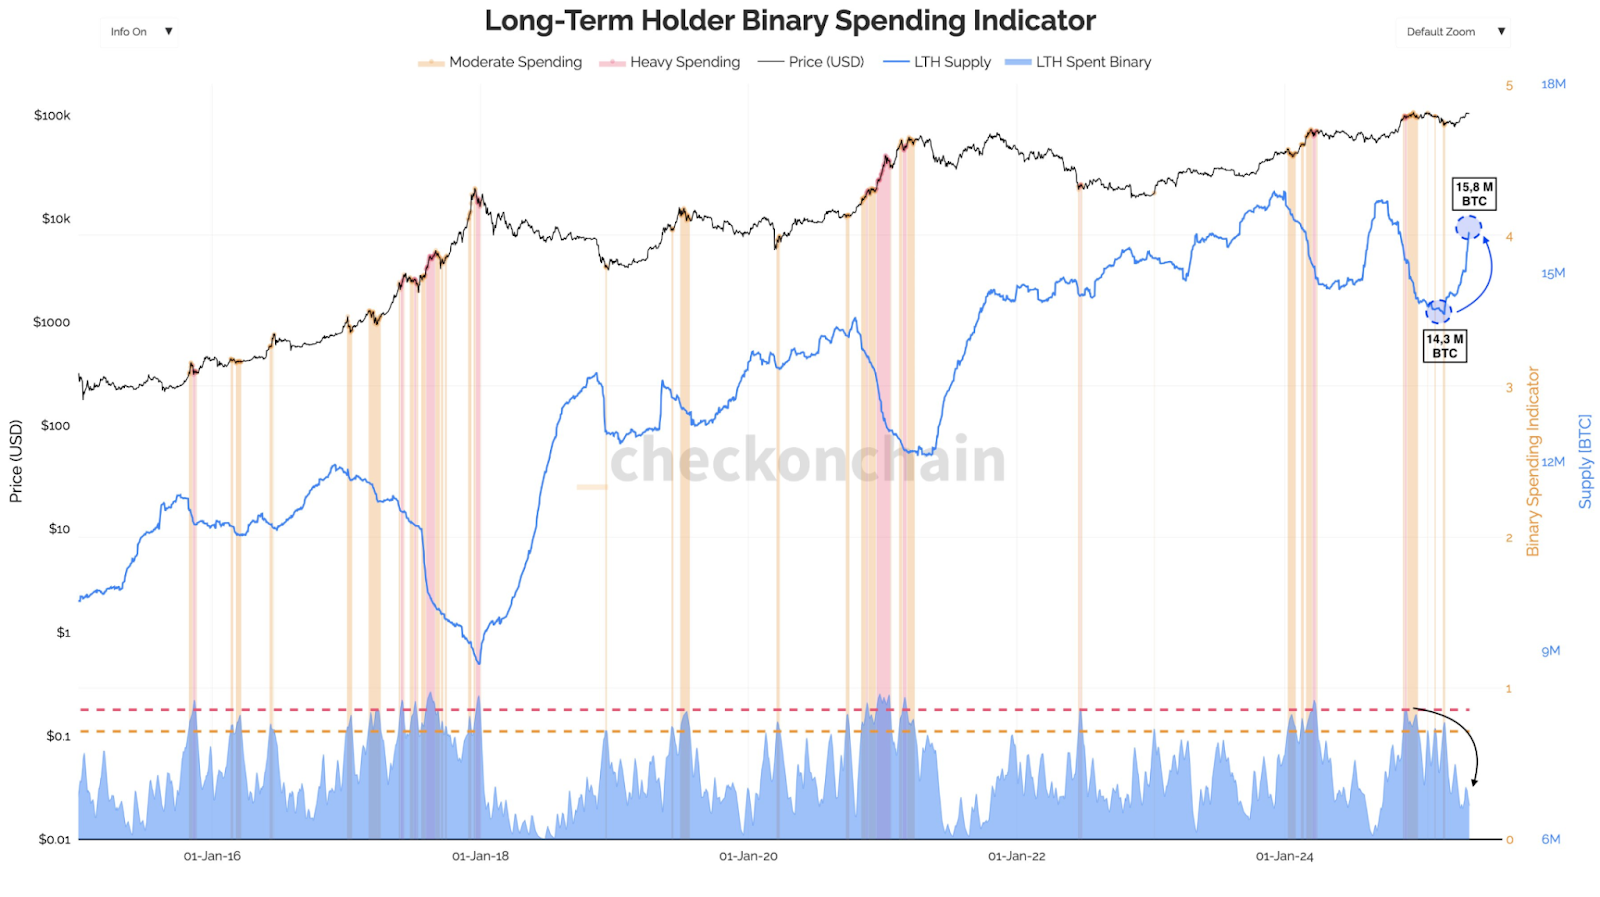
In late 2024 into 2025, the LTH supply curve has steepened, meaning there has been strong accumulation and little selling. This time there are hardly any periods of heavy LTH selling, usually shown in red. This indicates that long-term holders of Bitcoin believe in Bitcoin’s value.
Furthermore, the binary spending indicator (light blue at the bottom of the first chart) has also decreased at the same time.
This implies that fewer long-term holders are spending or moving their coins and hence a sentiment of holding and not trading. A rise in LTH supply with decreasing spending indicators is usually a sign of market confidence.
Short-Term Traders Back in Profit as Margin Recovers to +21%
Additionally, traders holding Bitcoin for 1 to 3 months are also back in the green. The margin swung 40% points in one month, from -19% in April 2025 to +21%.
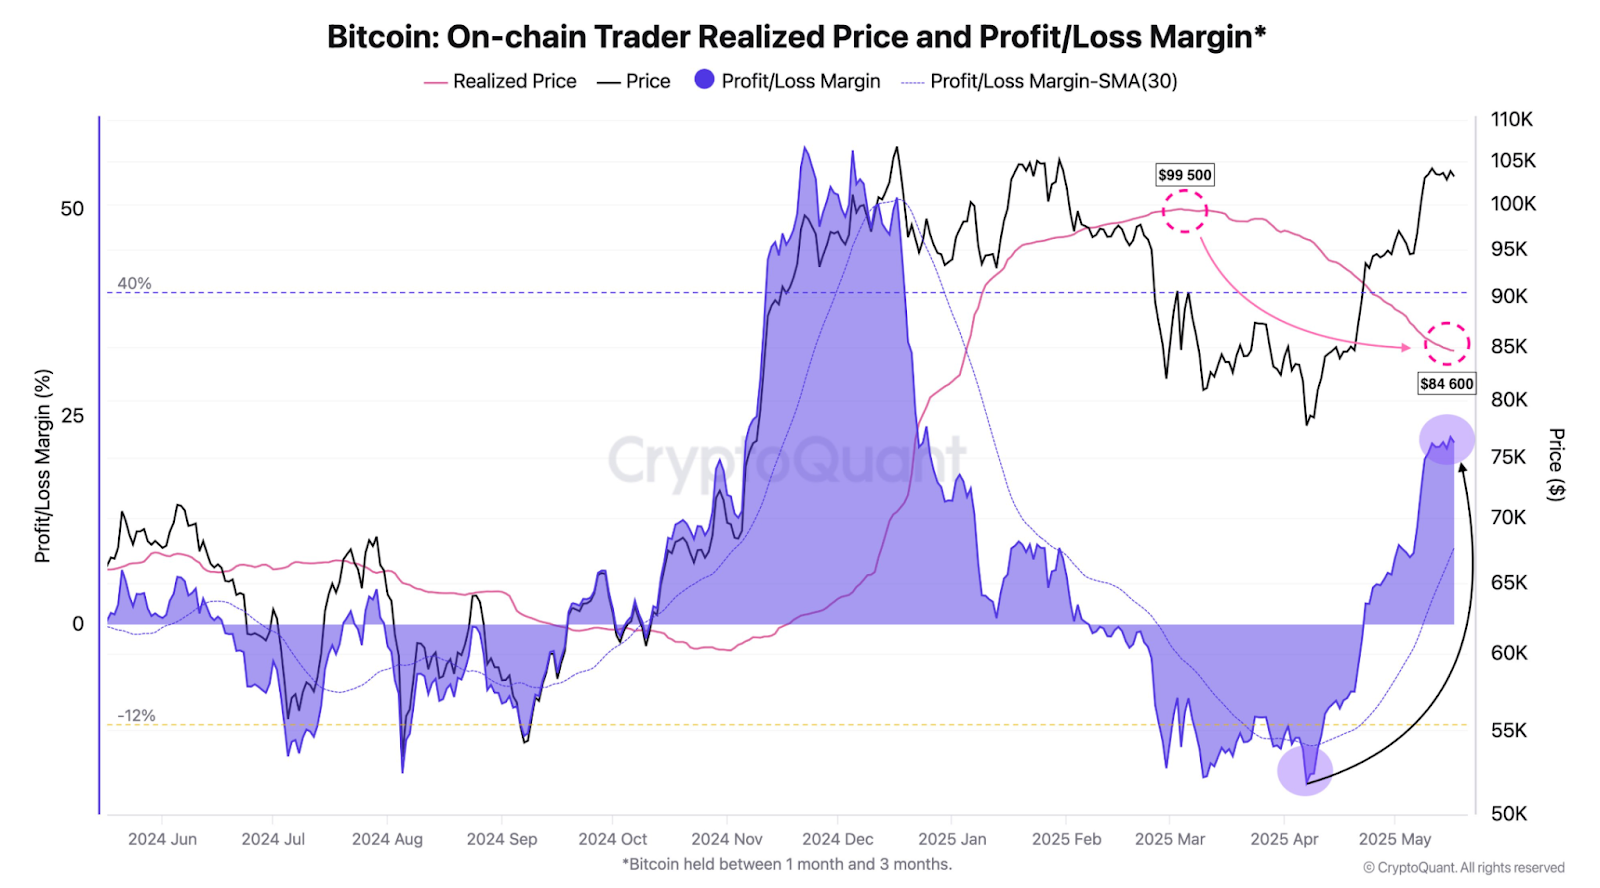
After Bitcoin fell to around $74,000, the realized price of this cohort dropped to $84,600 during that period. This implies that many bought during or just before the dip and are currently seeing the returns.
Currently, the 30 day moving average of the profit/loss margin is around +9% which is far below the +40% level that typically precedes mass profit taking.
While traders are now in profit, most have not yet reached a point where they typically start selling in large numbers. With the rapid margin shift and continued price upward movement, however, it’s possible that more traders will start locking in gains if the rally continues.
Technical Chart Patterns Point to Breakout Toward $116,000
Furthermore, the technical setup shows the price is squeezed between resistance around $104,000 and support near $102,000 and shows a converging triangle pattern. Before a price breakout, this type of pattern usually occurs.
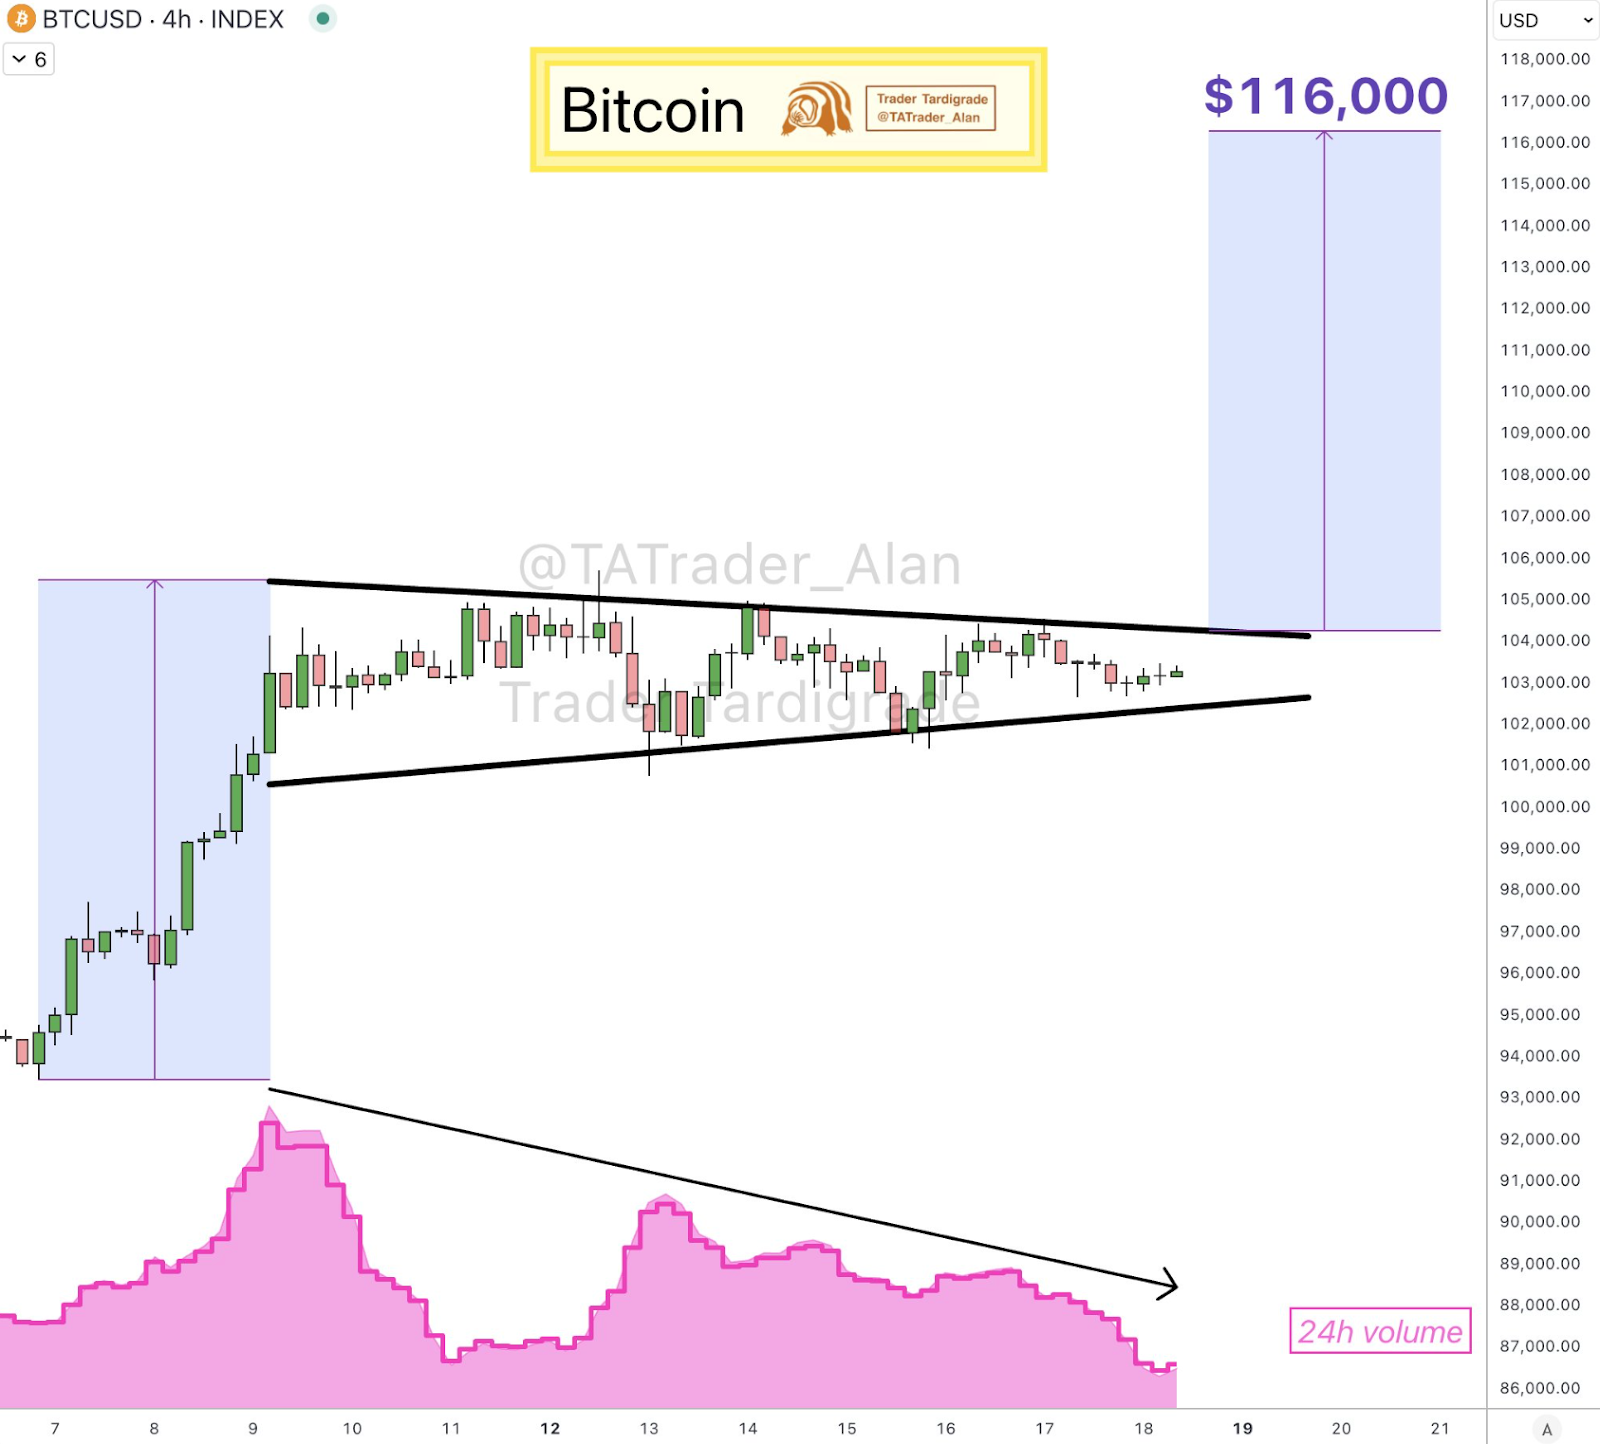
Trader Alan says Bitcoin could go as high as $116,000 if it breaks out of this pattern upward. The projection of the height of the previous move into the triangle is upwards.
Meanwhile, the pink at the bottom of the chart shows that volume has been steadily declining. Traders often wait for confirmation before acting, and this decline in volume often precedes a sharp move.
If this move breaks out, a strong rise in volume would increase the chances of it reaching the projected level.
Widening Price Gap Puts Pressure on Sentiment
A wide gap has emerged between the realized price ($84,600) and market price (~$104,000). This gap suggests many holders are sitting on healthy profits.
Although the average profit margin sits above 20%, it remains below the overheated 40% level. This supports a view that the market is not yet in mass distribution mode.
Meanwhile, long-term holders are not moving coins aggressively. This holding pattern removes overhead supply pressure and may help BTC maintain upward momentum.
Disclaimer
In this article, the views and opinions stated by the author or any people named are for informational purposes only. And they don’t establish the investment, financial, or any other advice. Trading or investing in cryptocurrency assets comes with a risk of financial loss.