
 NEAR Protocol
 Pearl
Pearl Bitcoin
 Puffer
 ZKsync
 Pudgy Penguins
 Hyperliquid

Key Insights:
- Over 1 million ETH (5.5% of supply) withdrawn from exchanges in 30 days, dropping total supply to just 17 million.
- This is the sharpest ETH exchange outflow since 2021.
- ETH TD Sequential indicator shows a sell signal.
Ethereum (ETH) continued its rebound in May as investors pulled coins off exchanges. The move reduced available supply and reinforced the bullish thesis. However, technical indicators now point to a possible short-term correction.
1 Million Ethereum (ETH) Leaves Exchanges in 30 Days
According to CryptoBusy, nearly 1 million ETH left exchanges in the past month. The outflow represents 5.5% of total supply and dropped total balances to 17 million—its lowest since the 2021 bull run.
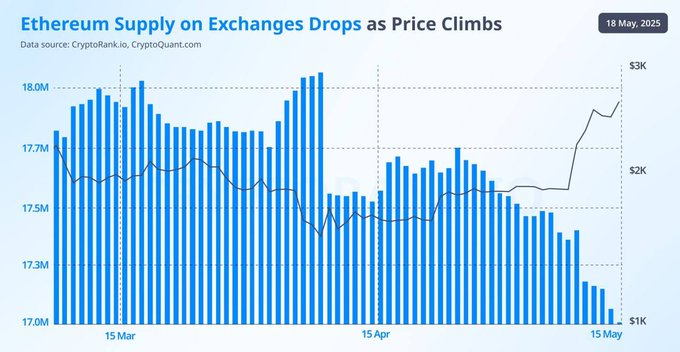
This significant outflow is not just a technical event. Taking coins out of exchanges usually means greater confidence about future value, as sellers may not feel an immediate urge to cash out. CryptoBusy’s chart revealed that as exchange balances went down, ETH price jumped from $1,800 to $2,600, increasing by 44%.
The previous occurrence of a large token outflow led to an extended bull run that drove Ethereum prices to hit all-time highs. With demand increasing, chances are good that similar movements might take place in the near future.
Short-Term Caution Despite Supply Squeeze
According to Ali Charts, there is a possibility of a short-term drop in ETH, as indicated by the TD Sequential indicator. The technical tool indicated that there might be a change in ETH’s trend and just flashed a sell signal on the 3-day chart.
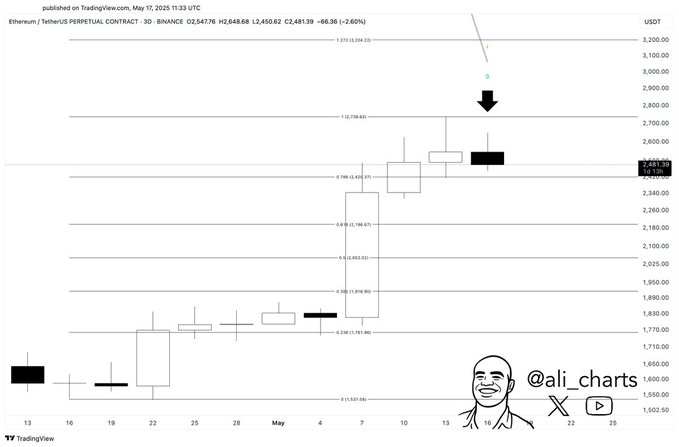
ETH price is struggling to rise past $2,650 to $2,700, a point that coincides with key Fibonacci points. If a pullback happens after the sell signal, ETH may drop to the $2,200 region before aiming for an uptrend. This pattern happened several times when Ethereum price faced selling pressure at important resistance levels before rising in price.
Even so, the situation looks positive as the exchange supply points to investors accumulating their holdings. This might help the downside move within a predetermined range, despite any short-term blips.
Analysts See $3,500 If Bulls Regain Control
While TD Sequential suggested the market is due for a correction, other analysts are hopeful about ETH’s growth in the future. According to Crypto Gems, the $3,500 target for ETH was reached due to a strong breakout from a descending line.
Additionally, the ongoing formation along with the recent break of the 200-day moving average strengthens the bullish argument.
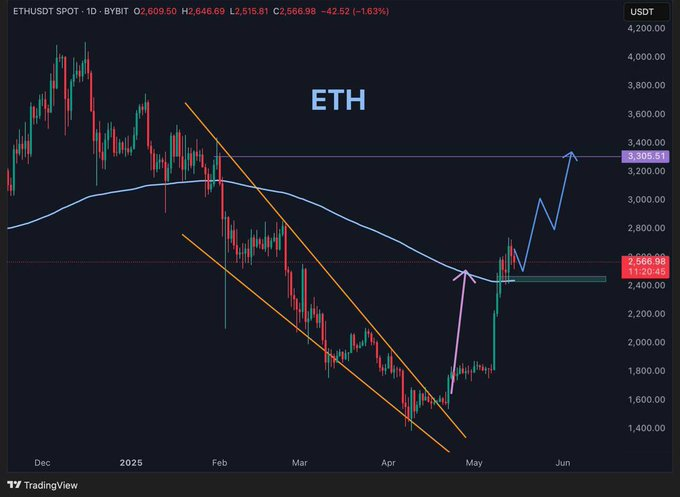
According to Crypto Gems‘ daily chart, Ethereum managed to move upwards after a long drop. When the price rises above the 200-day moving average, it usually signals a significant start of an upward trend for traders. Reaching $3,500 will not be easy, especially since $3,000 must be beaten, yet the structure still points towards more rises ahead.
Besides the technical factors, a positive market sentiment supports ETH, as institutional traders and network updates make it more appealing. If the market trends continue, this top altcoin may witness major increases as it gets near these resistances.
Key Levels and Long-Term Outlook
To maintain bullish momentum, ETH must break and hold above $2,700. The $3,000 level is the next resistance, followed by the $3,500 target. These levels align with major historical zones.
If rejected, ETH could retest support between $2,200 and $2,300. However, the declining exchange supply provides a bullish cushion.
Investor sentiment remains optimistic as institutional demand rises and fundamentals improve. If demand continues outpacing supply, the setup favors a longer-term price rally.
Disclaimer
This article is for informational purposes only and provides no financial, investment, or other advice. The author or any people mentioned in this article are not responsible for any financial loss that may occur from investing in or trading. Please do your research before making any financial decisions.



