Bitcoin
 Pearl
Pearl Starknet
 Zerebro
 NEAR Protocol
 Solana
 Quantus

Key Insights:
- SUI price broke out of a falling wedge and now targets $5.30, per mid-term chart setups.
- A sustained move above $4.00 could confirm bullish continuation toward $5.30.
- RSI and MACD support upside momentum, key support lies at $3.60 on the daily.
SUI price is gaining bullish momentum after a clean breakout from a falling wedge pattern. The market is closely tracking Bitcoin’s effort to break past the $4.00 mark. The increase in Total Value Locked (TVL) is what supports the move. This makes SUI the fastest-growing blockchain recently.
SUI Price Breaks Out of Falling Wedge as Bulls Eye $4.00
SUI price broke out of a falling wedge, a bullish reversal pattern confirmed on both the 4-hour and daily charts. CryptoBusy believes that this breakout marks the beginning of a strong uptrend. After several weeks of consolidation, prices started to rise, providing evidence for increased buying action.
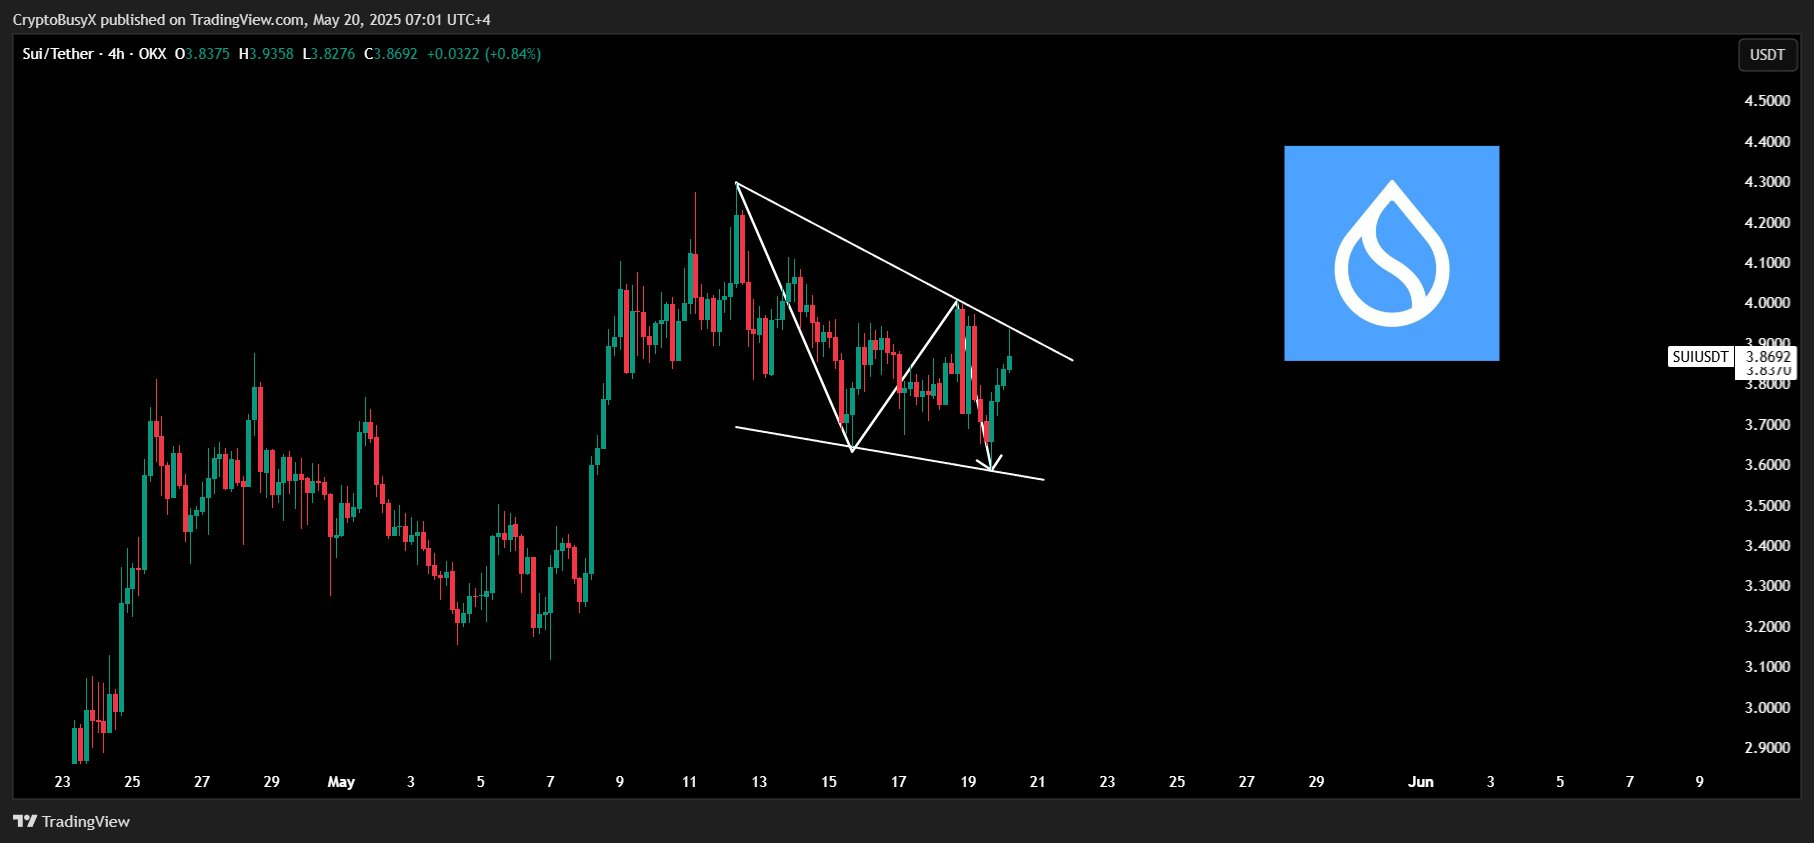
The breakout occurred near $3.60. Afterward, SUI price climbed steadily, hitting higher lows on each rebound. According to the analysts, the price may try to break through the $4.00 resistance level. If the market closes above this level every day, it would show there is short-term strength.
Additionally, technical indicators support this view. RSI stands at 58, indicating there is more room for prices to increase for buyers. Trading activity is increasing, which demonstrates strength during breakout situations. If the price remains above $4.00 for a while, traders could aim for higher values.
Analysts Set SUI Price $5.30 Target
Solberg Invest posted a mid-term SUI price prediction of $5.30. He said this target is determined by using the measured move of the wedge formation. The chart indicated that the altcoin price could break out and then retest $4.20 before resuming its move up to $5.30.
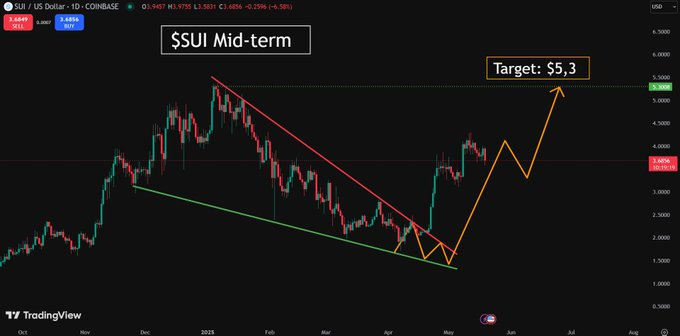
The new target aligns with the resistance levels set by the market in January and February. The trend might keep going if the bulls hold the $4.00 level. Price action is now being supported by the 50-day moving average at $3.60 and the 100-day moving average at $3.30.
More so, MACD confirmed this momentum. The MACD line crossed above the signal line, indicating that it might be time to buy. Concurrently, the histogram is expanding, showing strength in the uptrend. Should the price stay higher than $4.00 and form more highs, the next target could be around $5.30.
SUI Price Tops Chains in Total Value Locked Growth
On-chain data backed the current bullish price action. According to Giannis Andreou, SUI has experienced the most notable increase in TVL when compared to other chains within the last 30 days. Between April 19 and May 17, 2025, the total value locked in SUI increased by 68.11%.
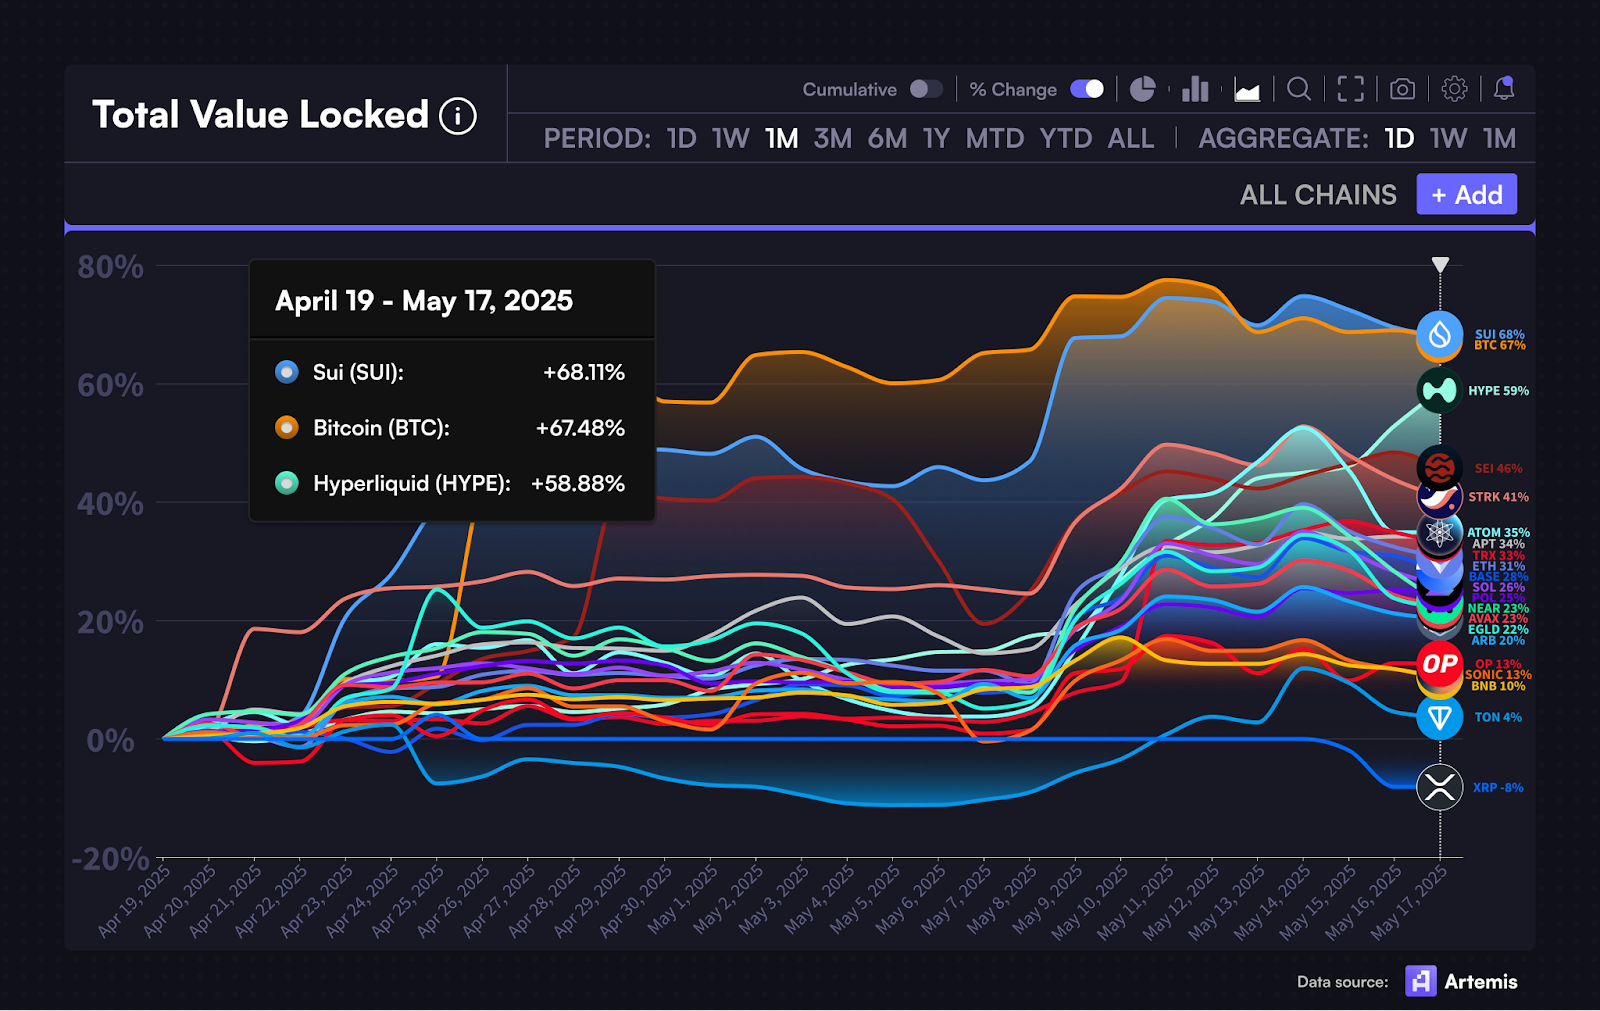
This growth outpaced Bitcoin’s 67.48% and Hyperliquid’s 58.88%. An increase in TVL shows more capital being invested in the ecosystem of the network’s DeFi. This indicates that users are actively staking, lending and storing value inside the SUI blockchain.
Increasing TVL often backs up positive price trends. It brings down the number of tokens in circulation, helps investors feel secure and typically attracts new investment. As a result, SUI demonstrated strong foundation as well as technical potential.
The growth in the use of SUI-based applications and services may support further increases for the token. High TVL hints that users will stay long term, and more liquidity could help maintain a higher price.
Key Levels and Market Structure
The immediate resistance remains at $4.00. Different tests in May proved this level is still vital for confirming the pattern’s progress. Breaking and closing above this level might help change it into support, giving buyers a way to move up toward $4.30.
Further resistance lies at $4.75 and $5.00. These levels often begin where rejection levels do, which can lead to more people deciding to sell. If the cost continues rising, traders occasionally set aside some funds during resistance points to be protected and watch for a minor fall to invest more.
However, at $3.60 and $3.30, SUI price is likely to find strong support. That movement coincides with the wedge graph and the moving averages. Should the price sink beneath $3.30, the previous bullish breakout will not hold, and the price may remain in a range.
Disclaimer
This article is for informational purposes only and provides no financial, investment, or other advice. The author or any people mentioned in this article are not responsible for any financial loss that may occur from investing in or trading. Please do your research before making any financial decisions.