
 Altai the Tiger
 IGNITION
 streamoors
 Sword Inu
 NEAR Protocol
 Injective
 Quantus

Highlights:
- Short-term holders reduce exposure as BTC climbs above $107,000, signaling a maturing cycle.
- STH realized price at $94.5K becomes a critical support amid rising distribution trends.
- A $111M whale short at $107.7K adds pressure, suggesting growing caution near market highs.
Since Bitcoin (BTC) reached $107,000, short-term holders have started to sell. The data from the blockchain suggests less accumulation, and a major trader has taken a big short position, leading some to wonder if the bull cycle is almost over.
Short-Term Holders Hit the Exit as Bitcoin Surges Past $107K
According to Alphractal’s latest data, short-term holders are now selling Bitcoin rather than buying it. This change has taken place as Bitcoin is trading near $107,000–$110,000. In the past, this kind of behaviour has been seen close to the highest points in market cycles.
The data reveals how much supply is controlled by short-term and long-term holders. The red line is for long-term holder (LTH) supply, and the blue line represents short-term holder (STH) supply.
A downward slope of the blue line as the price goes up means that short-term investors are selling their shares. The latest numbers show that the supply of STH is now below 6 million BTC.
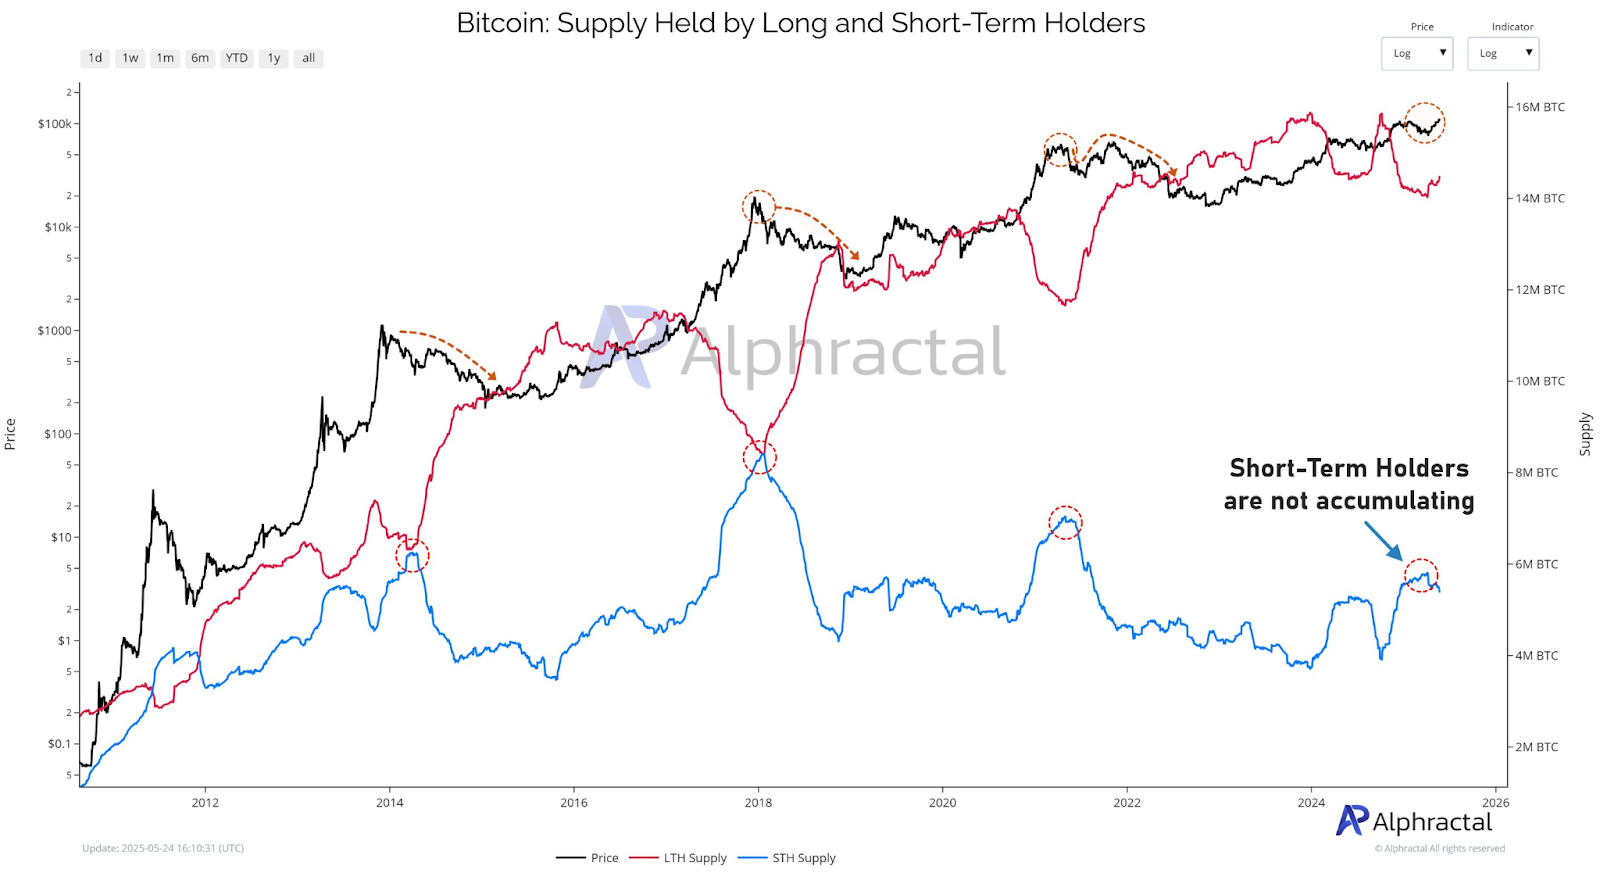
But the LTH supply is still very high, above 14 million BTC. Because of this difference, it appears that new investors are selling when prices go up, but those who have been in the market for longer are not.
$94.5K Becomes Key Support for Short-Term Buyers
While writing this piece, the realized price by short-term holders was $94,500, while the price for long-term holders was $33,000. The difference of $61,000 between the cost basis of new and old investors is very noticeable.
The $94.5K level is now an important support point for short-term holders. If the price falls below this point, many in this group would be at a loss, which can cause them to sell more.

The realized price is the average value at which coins were last traded. If the STH remains above the LTH, it shows that buyers are more involved and sure about their actions.
In all previous cycles, a new bull market started whenever the STH line crossed above the LTH line. At the beginning of the current cycle, this crossover happened again, which indicated the bear phase was over, and the market was turning up.
Both metrics are increasing, which means that investors are still buying and selling at different levels.
Distribution Dominates as Accumulation Momentum Slows Down
In addition, the data reveals that short-term holders are both buying and selling cryptocurrencies. Green bars show the amount of money earned each day, and red bars show the amount given out.
From early 2025 onwards, red bars have become the norm, meaning this group is selling more coins than they are buying.
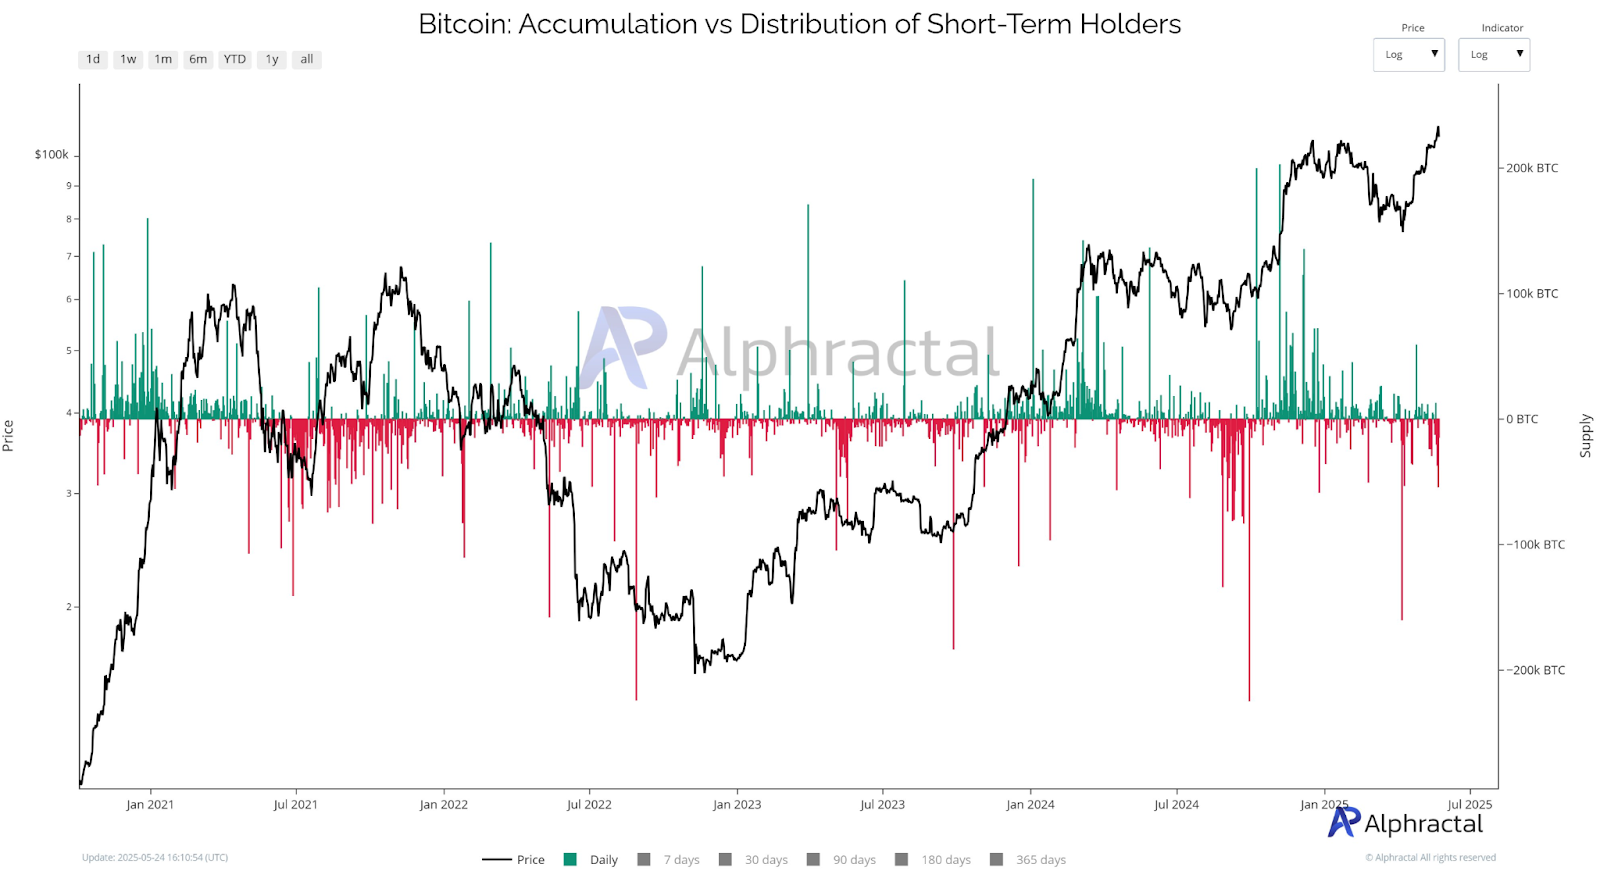
Daily distributions have regularly gone above -100,000 BTC. This means selling is a common practice. Meanwhile, the size and frequency of accumulation spikes have both decreased since the early 2024 period.
Bitcoin’s price, which is shown in black, has gone up as the market has fallen. Yet, if short-term buyers do not step in, price rallies could weaken.
Adding to bearish pressure, a big trader has added to the bearish trend by opening a $111.8 million short position on Bitcoin. According to Lookonchain, the trader switched from bullish to bearish at an average price of $107,711. The selling price for the position is $149,100.
This position uses leverage of 40x. If the token reaches $150,000, the trade will likely be closed. But having a short position means the trader anticipates the price will fall soon.

Positions of this size can shape the way the market feels. Shorting by big traders near the highest prices can signal that they are becoming more cautious. Even so, Bitcoin hit new records in 2021, despite short-term holders deciding to sell.
Is an Altcoin Season Coming After Bitcoin’s Peak?
In addition, a graph that covers a long period with a logarithmic scale highlights the changing valuation zones of Bitcoin using different colors.
When Bitcoin hit its highest point in a cycle or ATH, it was in the red zone, meaning there was peak excitement. After an ATH, the chart also highlights the start of an Altseason, when people tend to move their money from Bitcoin to other cryptocurrencies.

At present, BTC is in the green zone, which has often pointed to mid-cycle growth in the past. Before, when prices moved through this zone, they were followed by strong rallies to new highs.
If history repeats itself, the token could still go up before forming a cycle top in the red zone. According to the chart, Altseason 4 is expected to follow such a peak, as we have seen in the past.
Disclaimer
In this article, the views and opinions stated by the author or any people named are for informational purposes only. And they don’t establish the investment, financial, or any other advice. Trading or investing in cryptocurrency assets comes with a risk of financial loss.




