
 NEAR Protocol
 Bitcoin
 Puffer
 Hyperliquid
 ZKsync
 Pudgy Penguins
 Pearl
Pearl

Key Insights
- Solana captures 50% of all blockchain app revenue in the latest weekly data
- Over $175M bridged to Solana, with exchange balances dropping by $381M in 10 days
- SOL trades in a rising channel, testing resistance at $188 after steady accumulation
Network activity on Solana (SOL) is picking up again, and token demand is rising. Current data shows strong ecosystem growth from app revenue dominance, to token creation and exchange outflows.
SOL, meanwhile, is trading near a key resistance level around $188, and the price is tightening inside a rising channel.
Solana Leads All Chains in Weekly dApp Revenue
According to DefiLlama, Solana captured 50% of all blockchain application revenue between May 19 and May 25, 2025.
Combined, that’s more than Ethereum (16.59%), BNB Chain (15.2%), and Base (8.17%). Pump.fun, Phantom, and Bullx were Solana’s top-performing dApps of the week, with $ 10 M+, $ 4.5 M+, and $ 2.88 M+, respectively.
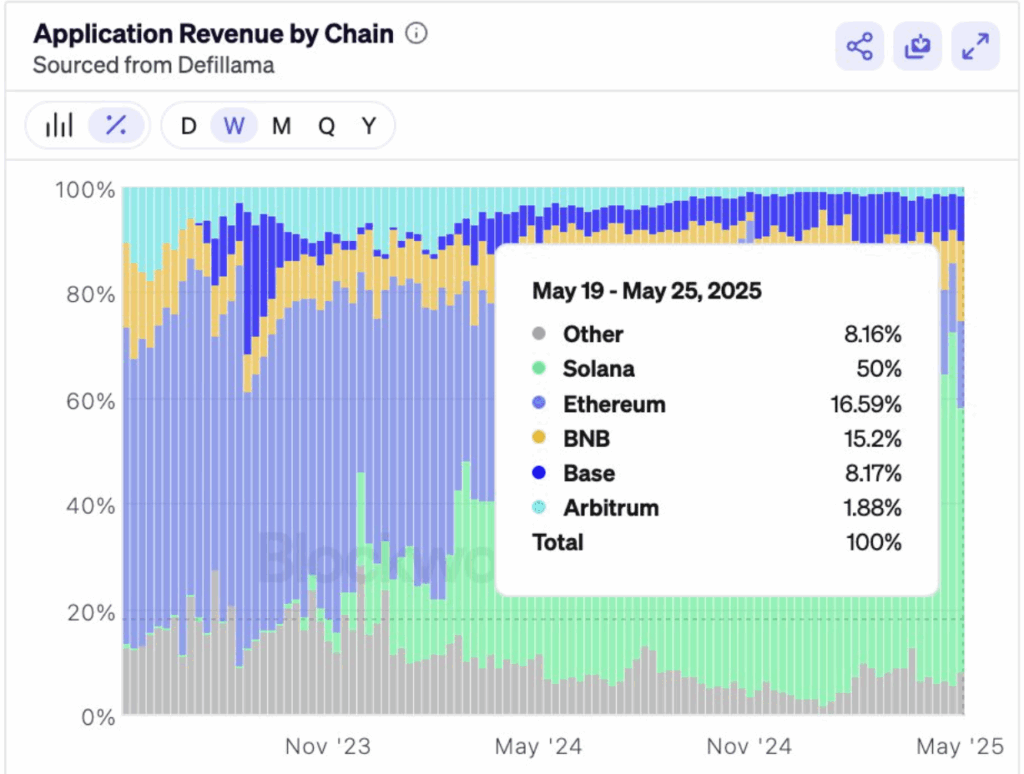
The fact that Solana’s user base is spending and interacting more actively than on competing chains is suggested by this strong revenue stream.
Solana’s 50% share of app revenue is a big jump compared to Ethereum, which has historically led in app revenue, indicating changing usage patterns.
Low fees and fast settlement may be helping dApps generate more transactions and Solana has continued to maintain them.
Token Launches Surge While Cross-Chain Inflows Grow
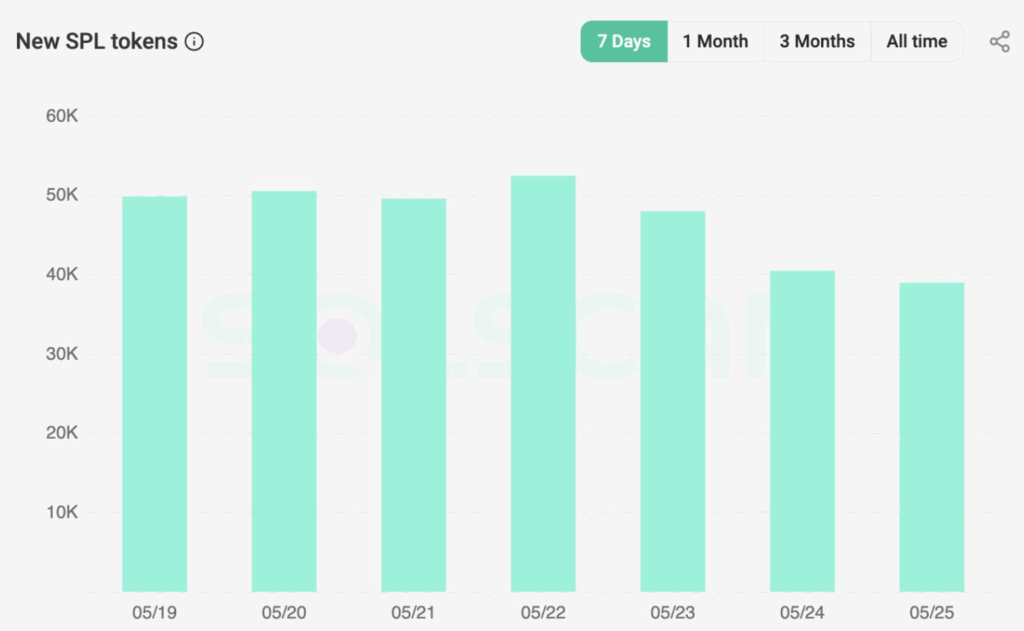
In just seven days, more than 320,000 new SPL tokens were launched on Solana. From May 19 to May 25, daily token creation stayed above 45,000, peaking near 53,000 on May 22.
Growth, in this case, is a result of increased developer activity and could lead to more diversity on the network, but may also include experimental or short-lived tokens.
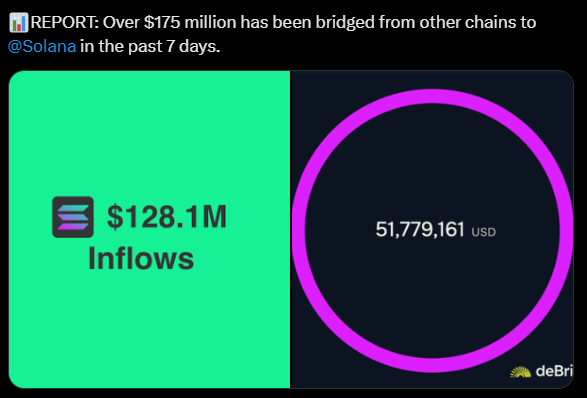
At the same time, Solana saw $128.1 million in inflows from other chains, as well as $51.77 million bridged into Solana during the same period.
This is over $175 million in bridged value in one week. High inflows mean that users are bringing liquidity into Solana, presumably to take part in token launches, new dApps or farming.
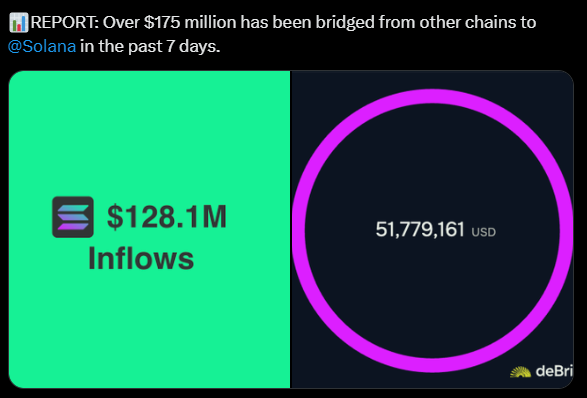
Such large cross-chain movements show increasing trust in the network stability and user experience of the token.
It’s also a sign that other chain users are moving their focus, perhaps because Solana is faster or cheaper. If this trend continues, it could take a larger share of the DeFi and NFT markets.
Exchange Balances Drop as Solana Accumulation Rises
According to Glassnode, more than $381 million worth of SOL has been withdrawn from exchanges in the last 10 days.
By May 25, the total balance of SOL on exchanges fell from above 32 million to under 30 million. Holders with lower exchange balances tend to move tokens to cold wallets, which is likely done for long-term storage.
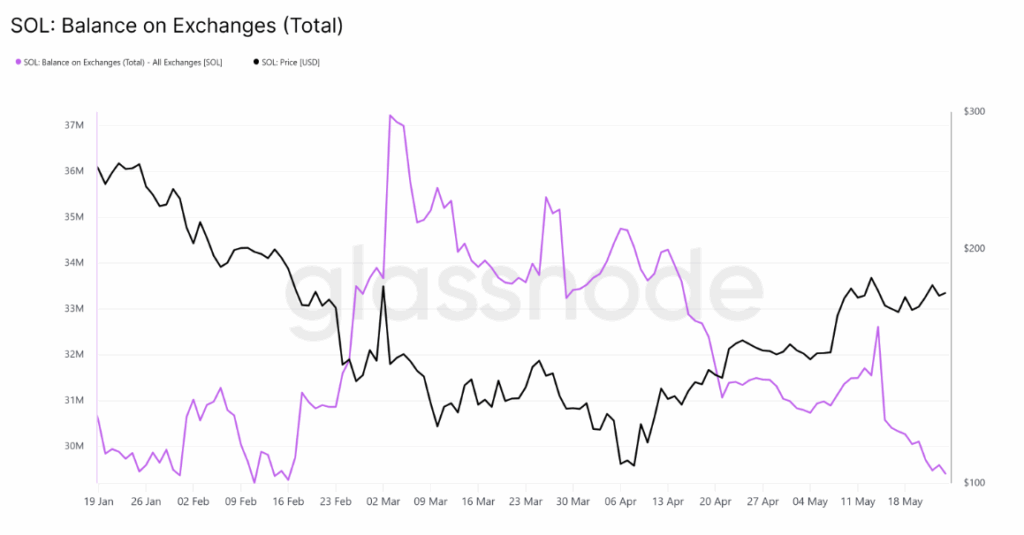
Meanwhile, SOL’s price was holding steady above $170 even as these outflows occurred. Such behaviour may indicate strong buyer interest and a lack of short-term selling pressure. In the past, exchange balances have sometimes declined sharply before price moves up.
Additionally, the price is in a channel of higher highs and higher lows. Triangle formations and a false breakout have been acting as consolidation zones before further upward movement in recent patterns.
$188 emerged as a key resistance level, and the current move could test it soon. On the daily chart, the Bollinger Bands are tightening, which is a sign that volatility is coming.
SOLmay confirm a breakout if it moves above $188 with strong volume. Otherwise, a rejection could result in short-term pullbacks to the support zone around $160.
Price has bounced off the lower trendline several times since early May, and the channel is still intact. There is nothing guaranteed, but technical signs indicate that momentum is still there.
Disclaimer
In this article, the views and opinions stated by the author or any people named are for informational purposes only. And they don’t establish the investment, financial, or any other advice. Trading or investing in cryptocurrency assets comes with a risk of financial loss.



