
 Pearl
Pearl Bitway
 Zcash
Zcash Walrus
 Aerodrome Finance
 Starknet
 NEAR Protocol

Key Insights:
- Ethereum defends $2,100 support, forms bullish dragonfly doji near $2,400 level.
- ETF inflows into ETH surged 68.4% in June, signaling rising institutional demand.
- Binance sees 61,000 ETH withdrawn, suggesting shift from short-term trading to holding.
ETH reclaims $2,400 after testing key support. Whale withdrawals and ETF flows hint at bullish reversal.
Ethereum (ETH) climbed toward the $2,500 mark on Monday after rebounding off a key multimonth support level. The move followed a brief dip to the $2,100–$2,200 range, where buyer interest resurfaced. The price printed a dragonfly doji on the three-day chart, often considered a reversal signal.
The bullish structure has developed alongside a surge in volume, increasing speculation of a breakout above $2,800.
Ethereum defends key zone, posts reversal candle
ETH defended the ascending trendline support that has held since April, forming a dragonfly doji around $2,150. The candle—marked by a long wick and bullish close—suggests bears lost momentum. Buyers reclaimed control, pushing ETH to close above $2,400.
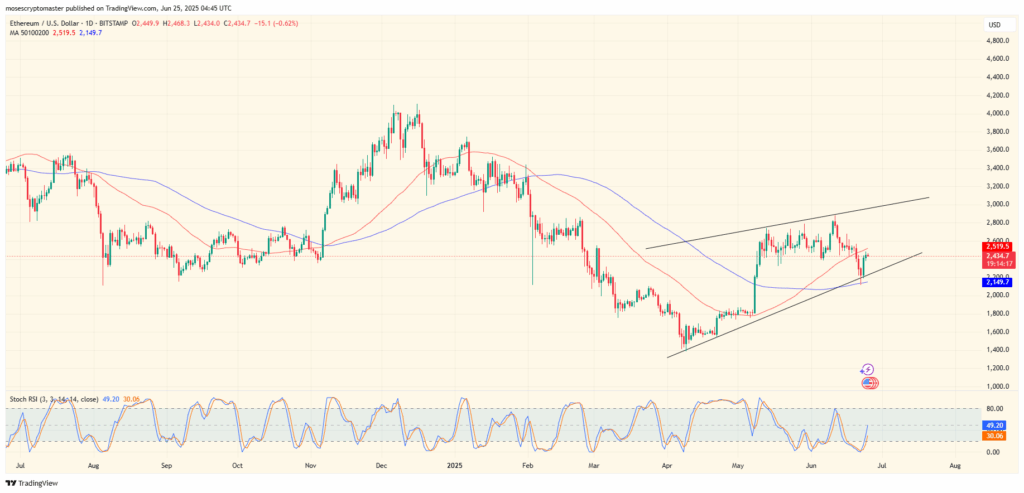
Technical indicators support this move. The stochastic RSI, a momentum oscillator, flipped higher from oversold territory, hinting at fresh upside potential. The 200-day moving average at $2,149 remains intact, reinforcing long-term bullish bias.
On-chain data also suggests growing bullish sentiment. According to CoinGlass, Ethereum’s liquidation heatmap shows heavy liquidity zones above $2,500. These levels could act as magnets as market makers hunt stop-loss clusters, potentially fueling a short squeeze.
ETF flows shift sharply toward Ethereum
Institutional flows now reflect a growing preference for Ethereum over Bitcoin.
In May, spot Bitcoin exchange-traded funds (ETFs) recorded $5.23 billion in net inflows. That figure fell to $2.64 billion in June. Meanwhile, spot Ethereum ETFs surged from $564 million to $950 million—an increase of 68.4%.
This 118% relative swing in favor of Ethereum supports the case for capital rotation. With Bitcoin inflows halving and ETH flows accelerating, institutions appear to be diversifying.
Swissblock’s analysis supports this view. In a recent post, the firm highlighted Ethereum’s underperformance relative to Bitcoin, calling the current setup a classic “catch-up” scenario. According to their “Zone 5” model, capital often rotates into ETH as BTC tops out.
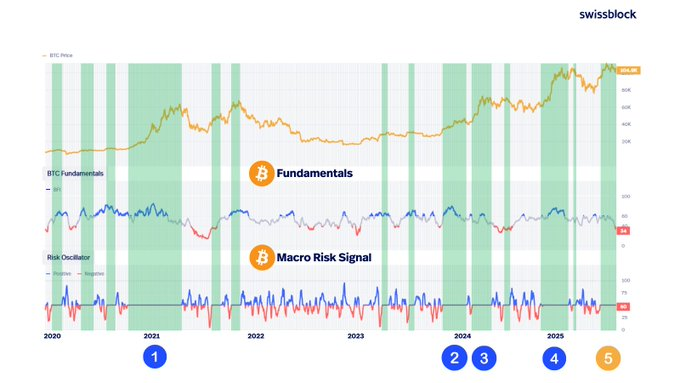
The ETH/BTC ratio currently sits near multi-year lows. Past cycles show that these conditions often precede Ethereum outperforming Bitcoin.
Whale activity signals long-term positioning
Onchain analyst Amr Taha noted that Binance saw over 61,000 ETH in net withdrawals on Monday. This signals a shift from short-term speculation to long-term holding strategies.
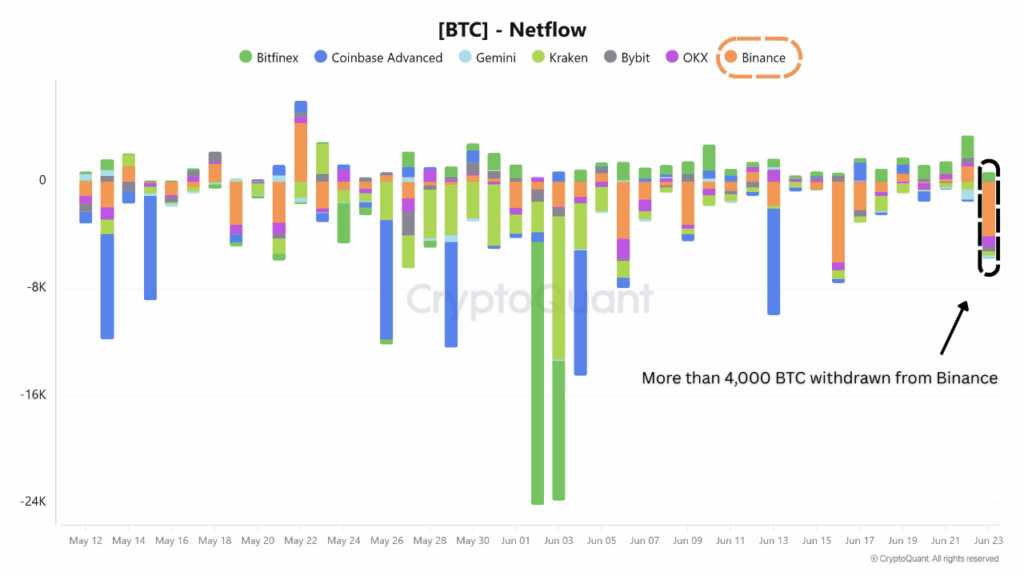
Historically, large-scale withdrawals indicate bullish intent, particularly when paired with rising ETF interest. The current pattern mirrors the 2021 rotation into Ethereum during the tail end of the Bitcoin-led surge.
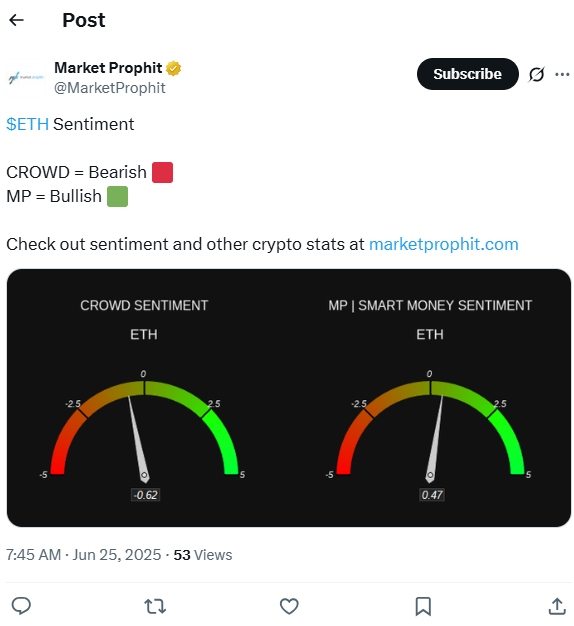
At the same time, market sentiment remains aligned. According to @MarketProphit on X, both crowd and algorithmic sentiment toward ETH remain bullish.
Liquidity hunt and volume surge drive rally
Ethereum’s rally coincides with its highest trading volume since the July–Aug. 2022 bear market period. This suggests renewed participation from both retail and institutional investors.
The recent recovery has also pushed ETH back above both its 50-day and 200-day moving averages. These levels now act as support, potentially giving bulls room to test the upper boundary of the rising wedge near $2,800.
While resistance remains between $2,750 and $2,850, the liquidation heatmap indicates a lack of strong sell pressure above. This implies a path of least resistance to the upside.
Retail sentiment and price forecasts heat up
Retail traders are beginning to show renewed enthusiasm. Crypto analyst StonkChris wrote, “It can legit go all the way to $20K if it wants to,” citing monthly RSI trends. While that target may be far off, the sentiment reflects broader optimism returning to Ethereum markets.
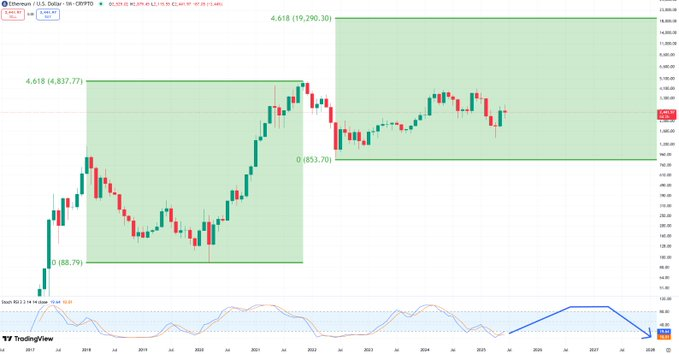
Still, Ethereum’s market structure remains in a transitional phase. A confirmed breakout above $2,800 would strengthen bullish momentum. Until then, traders will monitor volume, whale positioning, and ETF flows closely.
Disclaimer
This article is for informational purposes only and provides no financial, investment, or other advice. The author or any people mentioned in this article are not responsible for any financial loss that may occur from investing in or trading. Please do your research before making any financial decisions.


