
 astronaut
 Pearl
Pearl Hyperliquid
 Walrus
 Pudgy Penguins
 Bitcoin
 NEAR Protocol

Key Insights:
- XLM price gained 30% and is targeting $0.681, with $1.29 possible after breakout continuation.
- Falling wedge breakout projects 97% rally; structure aligns with prior XRP-like pattern.
- Multi-year resistance is under pressure; breakout could trigger a vertical move past $1.00.
XLM price has surged more than 30% recently, with analysts now projecting a much broader upside. Following a successful breakout from a long-term resistance zone, Stellar price is building momentum toward the $0.681 level. Should that resistance be overcome, technical prices can surge to $1.29.
XLM Price Reclaims Key Support With 102% Surge Targeted
According to Javon Marks, XLM price has already gained nearly 30% in recent sessions and may still be early in its move. The price structure is shaping a classic continuation pattern, and a key resistance level near $0.681. A rally above that would be more than 102% off the last base.
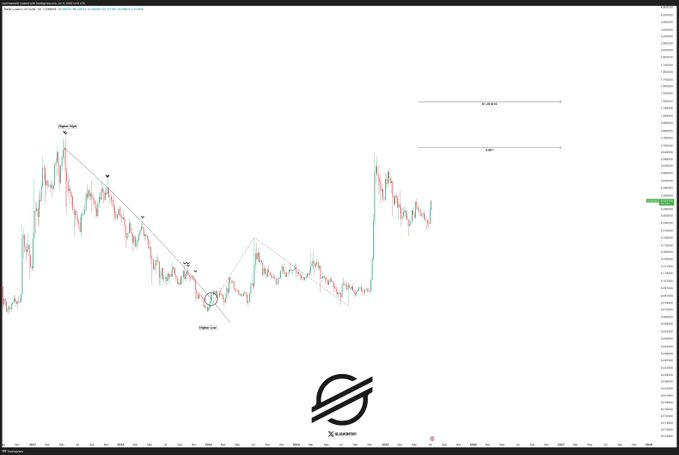
Additionally, provided the $0.681 is broken, he predicted the next technical level would be at $1.291819. The most recent upside flip occurs after a higher low formation and a reliable upward formation. These signals have aligned with Stellar’s prior bull runs, which began under similar setups in 2017 and 2020.
XLM price has also confirmed support above the $0.27–$0.30 consolidation zone, which served as a strong launchpad during previous cycles. The technical traders are concerned about whether the run can violate the resistance level shown in the red zone as the price moves between $0.34 and $0.38.
Break of $0.38 Could Ignite Next Phase Toward $0.681
CW, a crypto trader, stated that the critical level is at $0.38. On his daily chart, XLM price has approached the upper boundary of a multi-month range. The range of $0.34 to $0.38 has been resisting since the beginning of 2025, and this is a solid resistance point. The price is now trading just below this level.
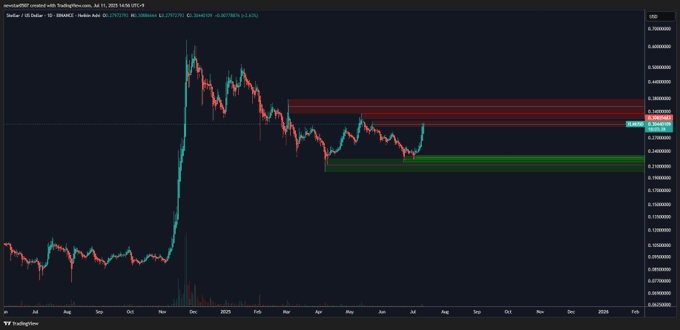
According to CW, a clean breakout above $0.38 is expected to cause an explosive move due to the cleared sell walls and higher volatility in the recent past. The move would likely confirm the market had been robust overall and would result in increased participation. On the one hand, should buyers breach this threshold, the likelihood of a sharp extension toward the $0.681 will increase.
The red zone depicted in the chart also corresponded to historical breakdown points. If it is reclaimed, the flip of supply to demand pushes bulls. The price has been trading above the 50-day average in the current sessions, and the volume is also increasing, suggesting even higher prices in the short term.
XLM Price Wedge Breakout Validates 97% Upside
World Of Charts added further confirmation by charting a falling wedge breakout on the daily XLM/USDT pair. The breakout was accomplished with a clean candle close that was above the descending trendline. This trend has historically marked a turnaround of the trend and also the high-probability targets on the upside moves.
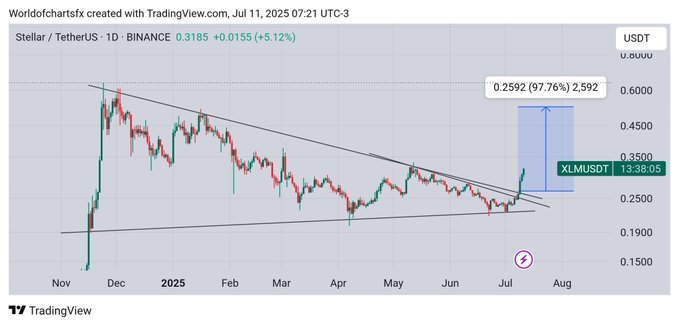
Based on the chart, the height of the wedge suggests a price target of $0.52-$0.55. It would indicate a 97% breakout move. Analysts have also compared Stellar’s recent setup to XRP’s structure before its explosive 2021 rally, suggesting similar continuation potential.
Momentum indicators are also supportive. The RSI is trending upward, with no immediate signs of overextension. These technical aspects make it more likely that the breakout is maintained and contributes to further price growth, especially should Bitcoin dominance decline further.
XLM Price Multi-Year Breakout Pattern Points to $1.00+
Cryptollica shared a macro chart showing Stellar price consolidating beneath a multi-year resistance line. The structure was similar to that of previous cycles, with extended horizontal consolidations followed by steep vertical rallies. The chart displayed a breakout on a downward price formation channel, with a larger breakout towards an upward move.
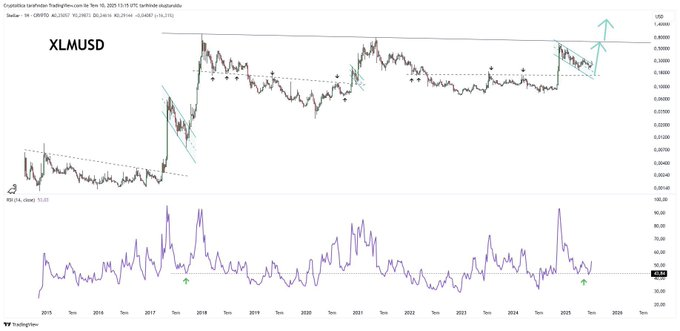
There is also early accumulation shown in volume indicators at the bottom of the chart, evident in 2017 and 2020. Cryptollica suggested that XLM price may be approaching its next “vertical” moment. The breakout zone nearly resembles the previous launching points, and the chart projection has an upward arrow with a target of the $0.80-$1.00 area.
Disclaimer
This article is for informational purposes only and provides no financial, investment, or other advice. The author or any people mentioned in this article are not responsible for any financial loss that may occur from investing in or trading. Please do your research before making any financial decisions.




