
 streamoors
 Sword Inu
 Altai the Tiger
 IGNITION
 no crying in the casino
 NEAR Protocol
 Pudgy Penguins

Bitcoin (BTC) reached a new all-time high of $119,123 on July 13, signaling renewed market strength and investor confidence. The milestone arrived as cumulative demand overwhelmed supply and macroeconomic conditions drove liquidity sharply higher. Analysts now assess the $120K region as critical, bullish setups building across charts.
BTC Surges to ATH as Liquidity and Volume Confirm Demand
Bitcoin recorded a new peak of $119,123 according to CoinGecko, climbing 1.3% in 24 hours and extending its bullish momentum.
CoinMarketCap confirmed a steady rise from $117K to above $119K throughout July 13. The steady trend indicates strong buyer presence across sessions and minimal sell-side resistance.
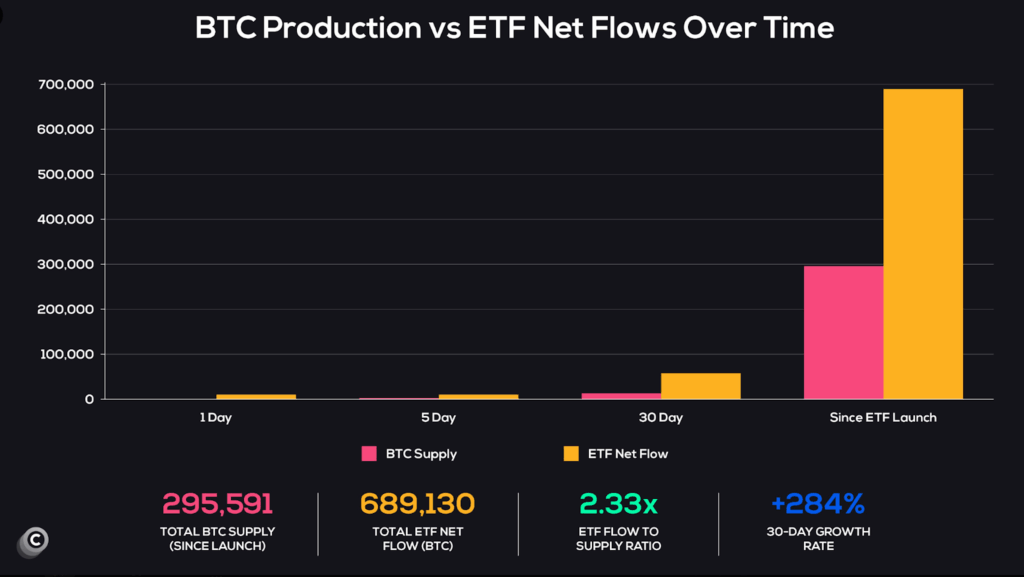
Coinvo noted that BTC demand is now outpacing production, creating the largest supply shock since inception. The gap is evident in a comparative bar chart showing 689,130 BTC in ETF net inflows versus only 295,591 BTC mined since ETF approvals. This created a 2.33x demand-to-supply imbalance, signaling aggressive accumulation by institutions.
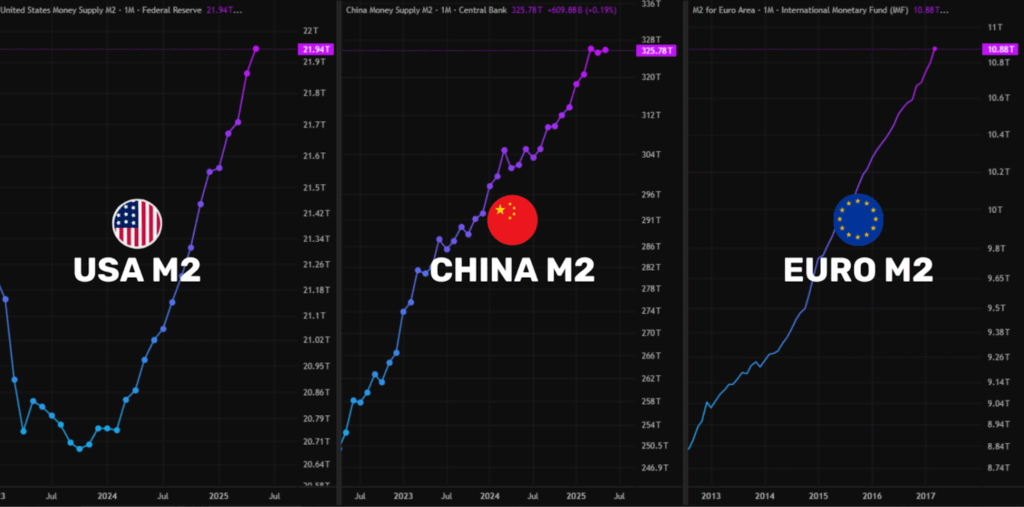
Meanwhile, global M2 money supply is also climbing sharply. Charts from the Federal Reserve, China’s Central Bank, and the European Monetary Fund reveal that the U.S., China, and Europe are all at all-time highs. This macroeconomic condition boosts asset inflation, and Bitcoin appears to be one of the main beneficiaries.
Bitcoin Faces $120K Barrier Amid Mounting Liquidation Pressure
Technical indicators now focus on a key resistance band between $119,000 and $120,000. According to Web3Niels, a clean break above this level could open the path toward $135K to $140K. If the rejection plays out, Bitcoin could retest the $114K to $115K region before attempting another breakout.
CoinGlass liquidation heatmaps show a heavy concentration of leverage pressure on both sides of price action. The $120K level holds $271 million in cumulative short liquidations, while $116K has $360.81 million in long liquidation risk. This tight spread increases the chance of violent price swings and forces leveraged traders into defensive positioning.
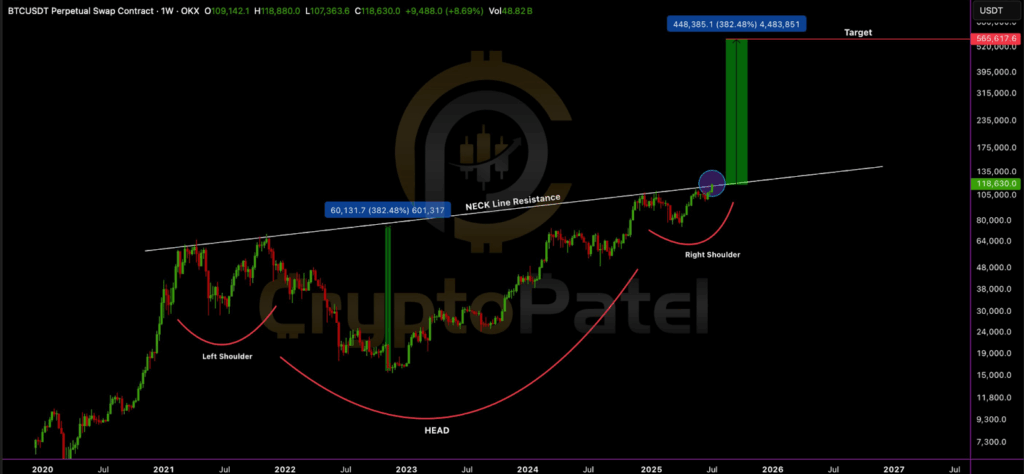
Moreover, Crypto Patel’s weekly chart shows Bitcoin testing a multi-year inverse head and shoulders formation. The pattern has formed since 2020, with the neckline resting around current price levels. A breakout above this structure may trigger a target exceeding $565,000 if momentum is sustained.
Rising On-Chain Confidence Meets Macro Tailwinds in Bitcoin Rally
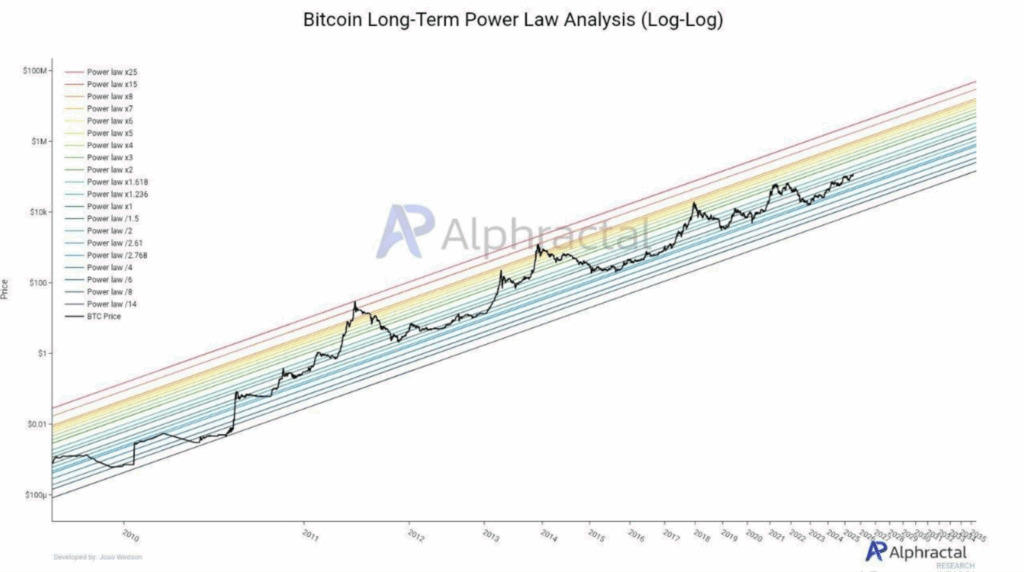
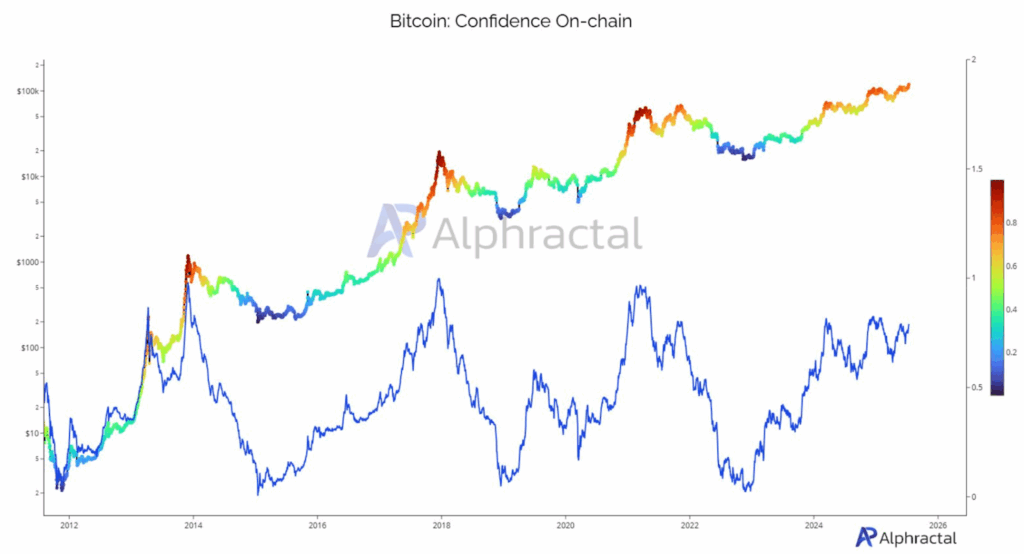
The on-chain sentiment is still growing according to the Confidence indicator offered by Alphractal. This indicator has the RHODL ratio, CVDD, Realized Price, and Puell Multiple, which all head upwards. The upward trend is coming back, but it is not close to 2021 or 2017 values, and Bitcoin may be at the last phase of this cycle, the period of euphoria.
The Kobeissi Letter identified some major macro events that would affect markets this week. It will be CPI and PPI inflation prints, retail sales, and 12 scheduled speeches of Federal Reserve officials.
Political debates on digital assets cause additional indecisiveness. According to Mario Nawfal, a significant week in the U.S. legislation may change crypto regulations, as the ban on CBDCs is also on the agenda. The bills have a chance to alter the way Americans engage with blockchain finance, as Trump-related individuals support pro-crypto changes.
In the meantime, Bitcoin derivatives trading is picking up pace. BTC derivatives data shows that the options volume increased by more than 61% to $4.05B, and the total futures volume increased to $69.96B. The open interest also increased, and the long/short ratios were well balanced among the exchanges, which showed that the participation was healthy in both directions.
The level of participation by institutions is also solid, with BlackRock and Strategy supposedly possessing 1.3 million BTC or 6.2% of the total supply. Such a high degree of concentrated ownership indicates an increasing institutional belief and a future constrained supply, particularly during bull markets.




