
 astronaut
 Pearl
Pearl Hyperliquid
 Walrus
 Pudgy Penguins
 Bitcoin
 NEAR Protocol

Key Insights:
- MSTR stock price has formed a double-top chart pattern.
- Similarly, Bitcoin has formed a similar pattern and a shooting star.
- These patterns point to an eventual Strategy stock breakdown.
MSTR stock price is stuck in a bear market, and the trend could accelerate as its long-term chart forms a highly bearish chart pattern. The bearish outlook is also based on the view that Bitcoin price has formed two high-risk patterns on the daily timeframe chart.
MSTR Stock Price Technical Analysis
The weekly timeframe chart shows that the Strategy stock price has moved sideways in the past few months. This performance happened even as Bitcoin, its main asset, jumped to a record high of $123,2000.
This chart points to more downside in the next few weeks as it has formed the highly bearish double-top pattern at $453.9. This pattern is characterized by two distinct highs and a neckline, which, in this case, is at $230.
Measuring the distance from the double-top point and the neckline shows that it is about 49%. Similarly, measuring the same level from the neckline gives the target price at $110, which coincides with the lowest level on August 5.
There are also signs that the MSTR stock price has formed a bearish divergence pattern. This pattern formed a series of higher lows and lower lows.
The moving average convergence and divergence (MACD) has also formed a divergence pattern, with the histogram moving below the zero line. An asset normally forms a major bearish breakout when this pattern emerges.
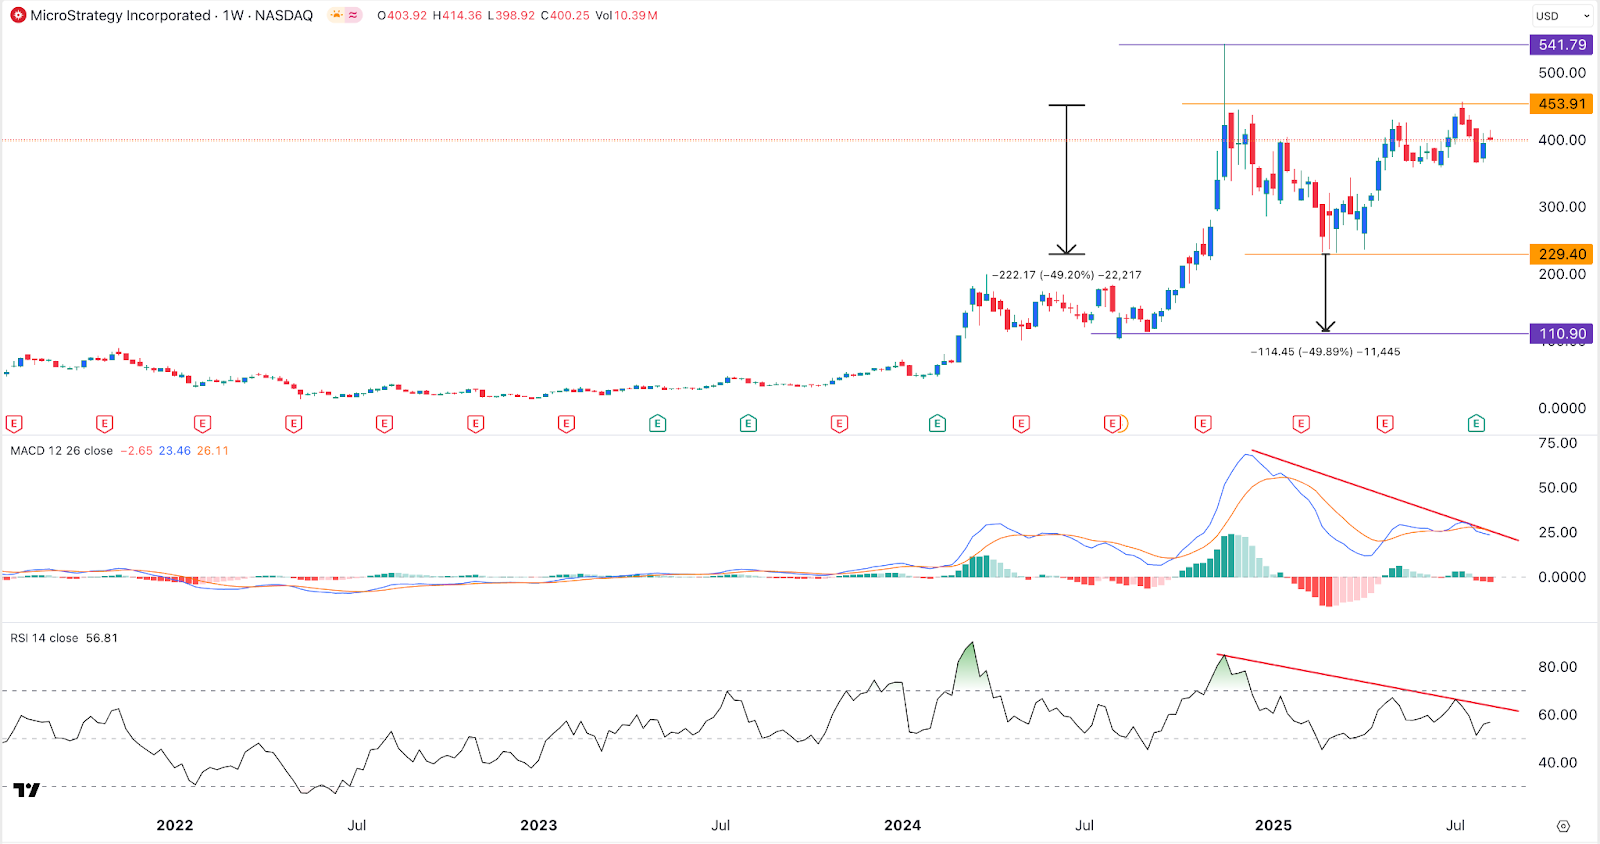
The bearish MSTR stock price forecast will become invalid if it surges above the double-top point at $453. Such a move will push it higher, potentially to $541, where it formed a false breakout in November last year.
Bitcoin Has Strong Fundamentals
Bitcoin’s performance often influences the stock strategy since the company is the biggest holder. It bought more coins last week, bringing its total holdings to 628,946, currently valued at over $75 billion.
While the correlation between BTC and MSTR has faded, chances are that a major Bitcoin crash will lead to more downside as the value of its treasuries will plunge.
Bitcoin has strong fundamentals, with its demand from institutional investors rising and exchange balances falling. Data shows that Bitcoin ETFs had over $178 million in inflows on Monday, bringing the cumulative total to $54 billion.
Some of the largest institutions are buying these funds. BlackRock, the biggest asset manager globally, has continued buying. And most recently, the endowment funds of Harvard and Brown Universities have accumulated the IBIT ETF.
CoinGlass data shows that the supply of Bitcoin in exchanges has continued falling and is now hovering near the lowest level in over 10 years.
BTC Price Technicals Point to a Pullback
While Bitcoin price has strong fundamentals, technical analysis points to a brief pullback this month. The daily chart below shows that the coin has formed a double-top chart pattern at $122,250, its highest level on Monday. This pattern has a neckline at $112,000, the lowest level this month.
The chart also shows that, like the MSTR stock price, BTC has also formed a bearish divergence pattern. It has also created a small shooting star candlestick pattern similar to what it formed on July 14 when it reached an all-time high.
A shooting star candlestick is made up of a small body and a long upper shadow. It normally happens at the top and is followed by a reversal.
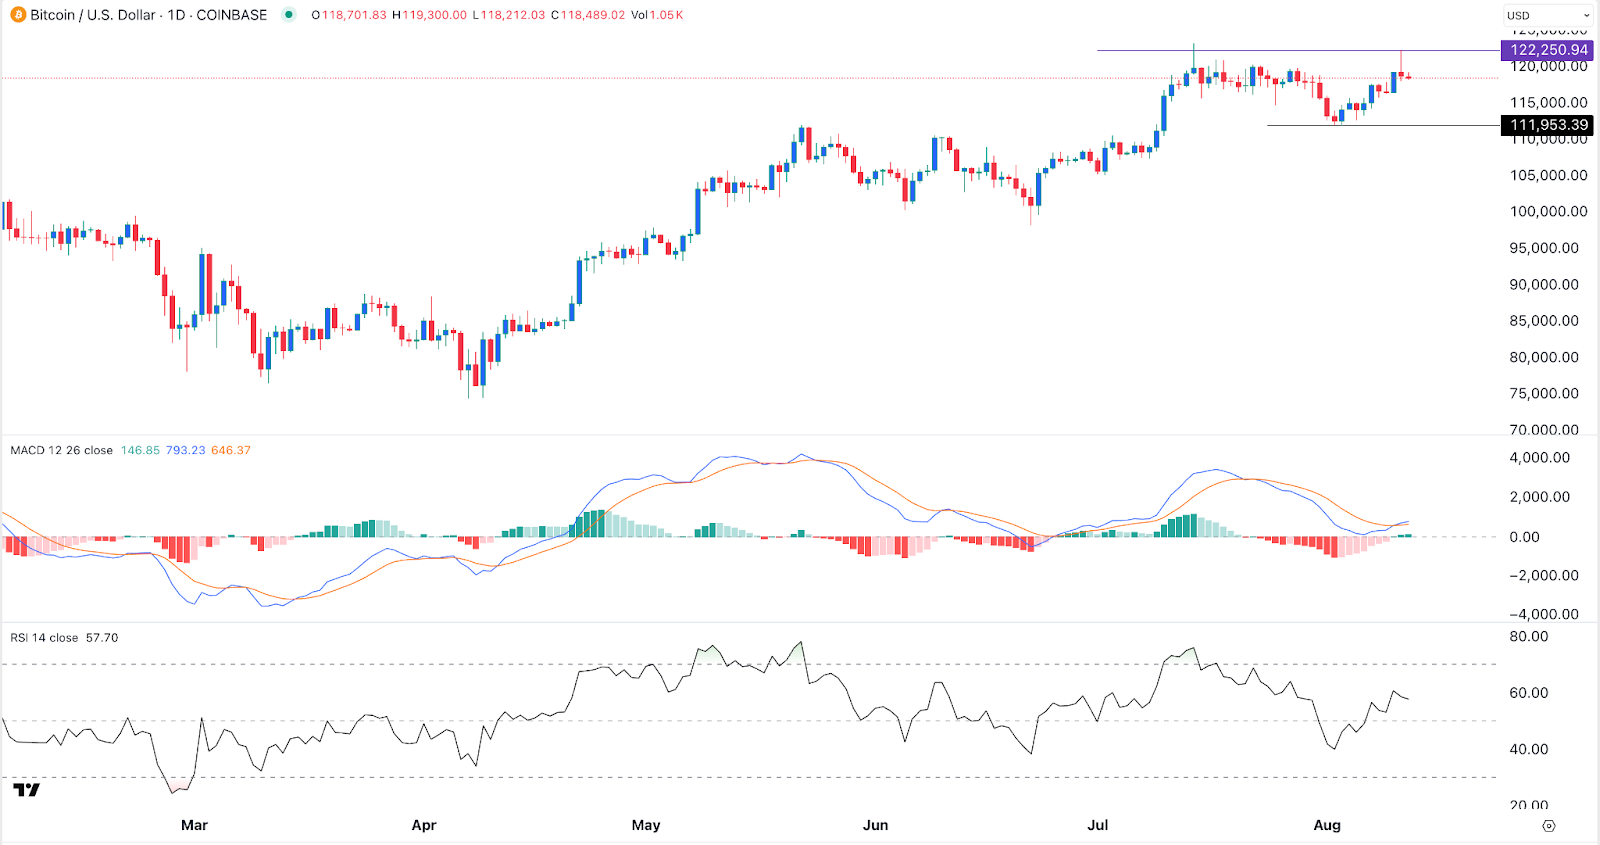
Therefore, it is likely that the Bitcoin price will pull back, potentially to the breakout at $112,000. A bullish breakout and continuation will be confirmed when it jumps above the all-time high of $123,200.
Summary
A strong Bitcoin price crash and the Strategy’s bearish patterns mean that the shares may drop in the near term. However, the stock will likely rebound in the long term as Bitcoin has a long record of doing well.
Disclaimer
This article is for informational purposes only and provides no financial, investment, or other advice. The author or any people mentioned in this article are not responsible for any financial loss that may occur from investing in or trading. Please do your research before making any financial decisions.



