
 Altai the Tiger
 IGNITION
 streamoors
 Sword Inu
 NEAR Protocol
 Injective
 Quantus

Key Insights:
- MSTR stock price has crashed and moved into a bear market in the past few weeks.
- Bitcoin price has formed a giant rising wedge chart pattern on the weekly chart.
- The next key catalyst for the stock will be this week’s Jackson Hole Symposium speech by Jerome Powell.
MSTR stock price tumbled by 7.4% on Tuesday as the crypto market plunged. Strategy dropped to $335, its lowest level since April this year and 26% below the year-to-date high. This article explains why the MicroStrategy stock may be on the cusp of a breakdown as Bitcoin falters.
Bitcoin Price Chart Analysis is Risky for MSTR Stock
A wedge is one of the most common reversal pattern in technical analysis. It is formed when an asset forms two trendlines that converge, either rising or falling.
The long-term chart shows that Bitcoin price has been in a slow uptrend after bottoming at $48,635 in August last year. This jump was not in a straight line as it formed a few pullbacks.
As a result, the coin has formed a rising wedge pattern whose two lines are nearing their confluence. This confluence means that the coin could be about to have a bearish breakdown.
Other technical reasons explain why the coin may plunge soon. As the chart shows, the two lines of the MACD indicator are about to cross each other, which is a risky sign.
In addition to this, the Relative Strength Index (RSI) has pointed downwards and moved below the RSI-based moving average. In most cases, this performance usually signals that an asset will continue its downtrend trend. It is also a sign of a bearish divergence pattern.
The Average Directional Index (ADX) has also moved sideways, which is a sign that it is losing its momentum.
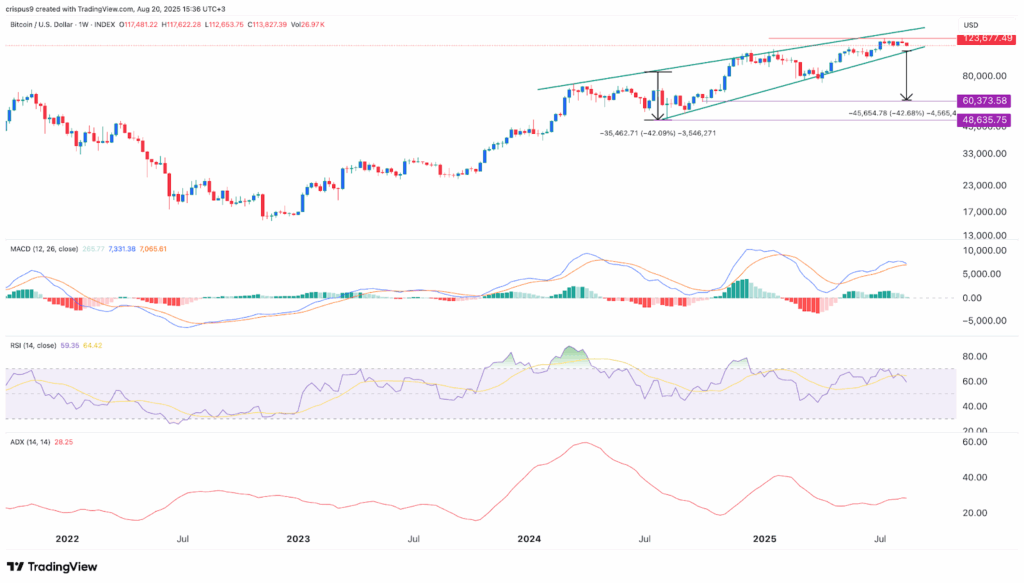
Therefore, there is a risk that the Bitcoin price will plunge in the next few days or weeks. If this happens, it may crash below $100,000.
Strategy Stock Price Analysis Points to a Crash Too
Meanwhile, the MSTR stock price has formed bearish chart patterns that point to a strong sell-off in the coming weeks.
The chart below reveals that it has formed a triple-top pattern at $456. This pattern is made up of three upper swings, which, in this case, were the highest levels in November, May, and July this year. It also has a neckline, which, in this case is at $237, its lowest point on March 10th.
Like Bitcoin, the MACD indicator has formed a bearish divergence pattern, while the Relative Strength Index continues to fall, and has just crossed the neutral point at 50.
The Average Directional Index has also dropped to 34 from the year-to-date high of 44, a sign that it has lost momentum. Therefore, the most likely scenario is where the MSTR stock price will dive and reach a low of $237.
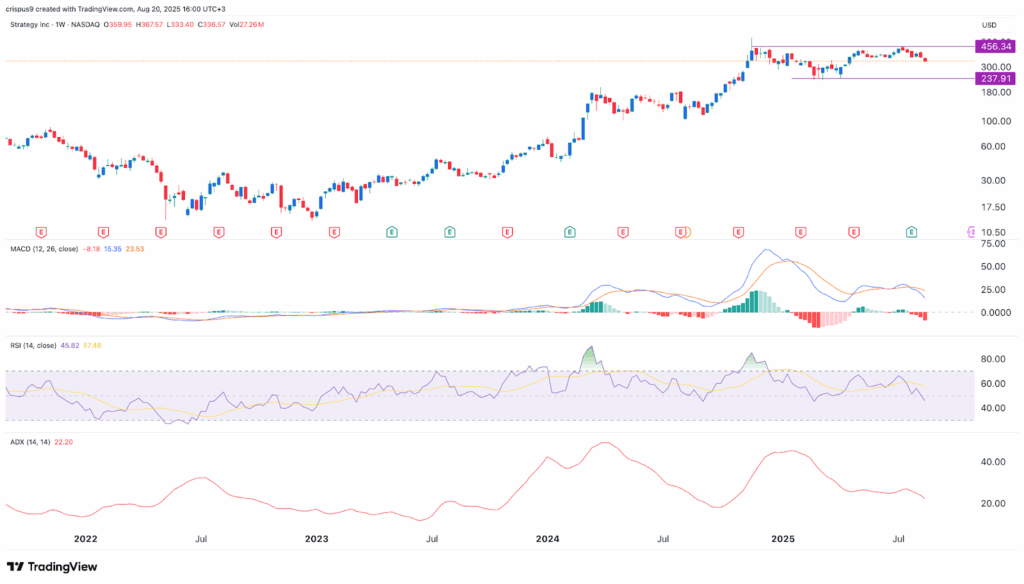
The bearish outlook will become invalid of it rises above the resistance level at $456. Such a move will point to more gains, potentially to $500.
Jackson Hole Symposium to be Catalyst for Bitcoin and MicroStrategy
The next important catalyst determining the Bitcoin and MSTR stock price action will be the upcoming Jerome Powell speech at the Jackson Hole Symposium in Wyoming on Friday.
This is a crucial meeting where the Fed Chair explains his economic thinking and shares what to expect when the Federal Open Market Committee (FOMC) meets in September.
MSTR and Bitcoin will likely rebound if he hints that the bank will cut interest rates to boost the labor market. This is in line with what analysts on Polymarket expects will happen. Bitcoin and crypto stocks do well when the Federal Reserve turns dovish.
While the correlation between MSTR and Bitcoin has faded recently, a Bitcoin rebound from the current slump will boost Strategy share price.
The other bullish catalyst for MSTR stock is that it has become a bargain by its historical standards. Its NAV multiple, which compares its Bitcoin holdings and the market capitalization, has dropped to 1.33, the lowest level since March 2024. It surged to a record high the last time it fell to these levels.




