Pearl
Pearl Bitway
 Pudgy Penguins
 Quantus
 Walrus
 Quant
Quant Artificial Superintelligence Alliance

Key Insights:
- Stellar (XLM) experienced a bullish flip on September 8, breaking above key resistance levels at $0.371.
- XLM price action resembles the fractal pattern of 2017, which points to the possibility of repeating the previous bullish momentum.
- XLM Technical Analysis as it surged by over 5% in 24 hours.
XLM price has flipped bullish for the first time since August 25. This change, which has been based on key technical points and market sentiment revived new optimism. Analysts are now readjusting their price targets for the digital asset.
XLM Price Flips Bullish Based on SuperTrend Indicator
Analyst Ali Martinez noted that Steller (XLM) price flipped bullish, representing a huge change from August 25. The bullish sentiment was confirmed by the SuperTrend indicator, another trend reversal tool.
As Ali’s analysis revealed, the XLM crypto price exceeded the resistance zone of $0.371, which has been a major resistance in the past few weeks. This is a breakout on top of the resistance, which is viewed as a bullish sign.
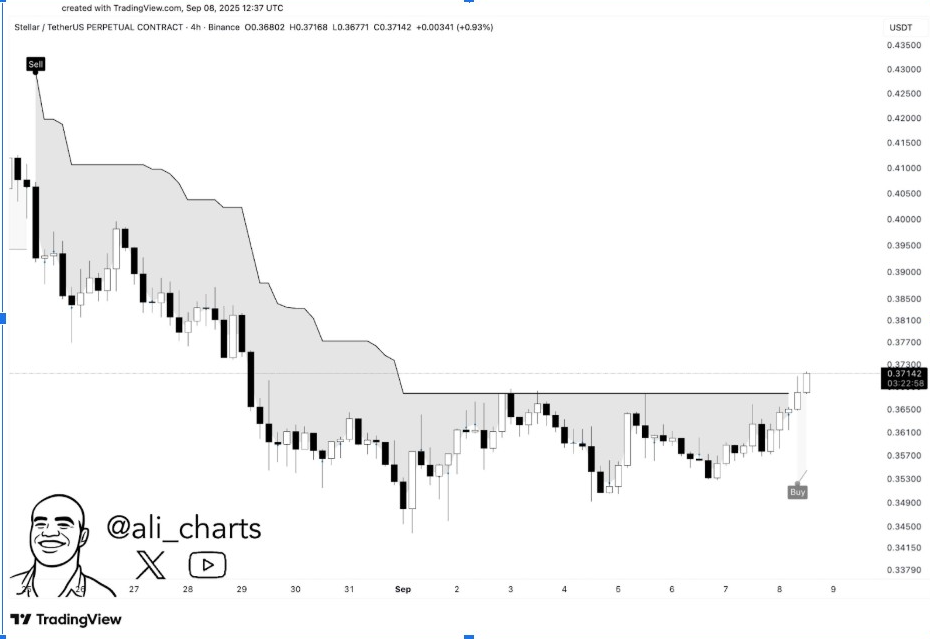
Having reached a bullish trend with the SuperTrend, XLM crypto price will continue its growth. The SuperTrend indicator is a tool that analysts normally use to verify which way the market is headed.
The breakout above $0.371 is an important milestone. It indicated that Stellar can overcome the resistance levels of $0.375 and $0.38.
Fractal Patterns of 2017 Point to a Huge Rally
Another analyst, Charting Guy, indicated the 2017 fractal behavior in XLM price action. This slightly elongated trend trailed the price action of XRP in its 2017 bull run.
According to Charting Guy, XLM price is currently in an accumulation phase before following a similar path to XRP’s 2017 breakout. This indicated that XLM is in the midst of building the foundation for a strong upward move.
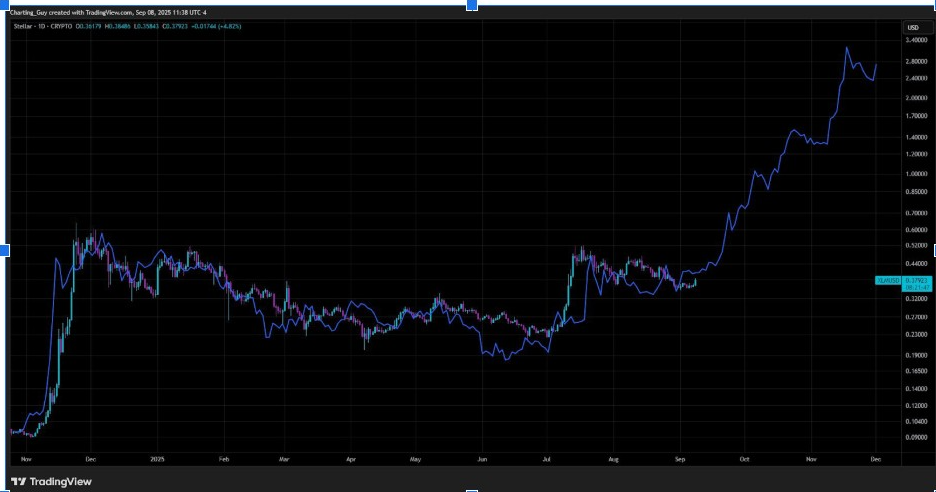
The 2017 fractal suggested that XLM could see massive price gains following the accumulation phase. If this fractal pattern continues to unfold, the top crypto could aim for a price surge towards previous highs.
Charting Guy compared the current market conditions to the situation for XRP in 2017, where prices skyrocketed after a long period of consolidation. This fractal analysis supports the bullish view of XLM and indicates that more price gains are on the horizon.
Hidden Accumulation Indicates Bullish Momentum
Furthermore, Barry also came up with more insights, pointing out hidden accumulation in XLM price within an important demand zone. The top altcoin just broke out of a descending channel, signifying shifting market dynamics.
The demand zone pinpointed by Barry at around the $0.34 price level had considerable build up, which could spell a further rise for the price. Barry’s analysis implied that the waning of the strength of sellers is paving the way for a major breakout.
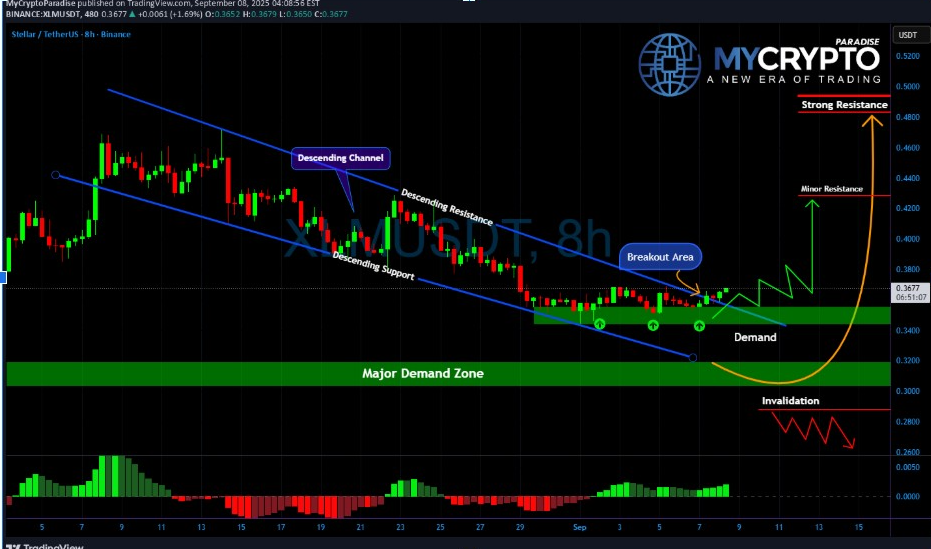
This breakout of the descending channel could result in a big rally. XLM price has already shown signs of increasing, breaching past the $0.37 resistance level. The next resistance zones to monitor are near $0.38 and $0.42.
However, if XLM crypto succeeds in breaking these levels, it could set the stage for a much bigger move. The hidden accumulation inside the demand zone showed that the recent price action is part of a longer-term bullish trend.
At the time of writing, Stellar (XLM) was trading at $0.3836, marking a 3% increase. Meanwhile, the trading volume surged by 56%, reaching $443 million, indicating a significant uptick in market activity.
Disclaimer
This article is for informational purposes only and provides no financial, investment, or other advice. The author or any people mentioned in this article are not responsible for any financial loss that may occur from investing in or trading. Please do your research before making any financial decisions.