
 astronaut
 Pearl
Pearl NEAR Protocol
 Walrus
 Zylo Ecosystem
 Bitcoin
 Hyperliquid
Analysts project Dogecoin price could soar to $0.75 if it breaks through major resistance levels between $0.35 and $0.42. The recent consolidation of the top meme coin, accompanied by a recurring 42-day cycle and symmetrical chart structures, indicates strengthening bullish momentum. Furthermore, the technical configuration of DOGE price reflected the accumulation phases before its explosive rallies in the past.
42-Day Cycle Predicts Next Dogecoin Price Rally
Analyst Trader Tardigrade highlighted a consistent 42-day pattern in Dogecoin price chart. Each cycle got a pullback, recovery, and a sharp rally. His chart depicted the price moving lower, stabilizing, and then increasing in a similar time interval. This cycle has been repeating since May, and the next potential phase is due in mid-October.
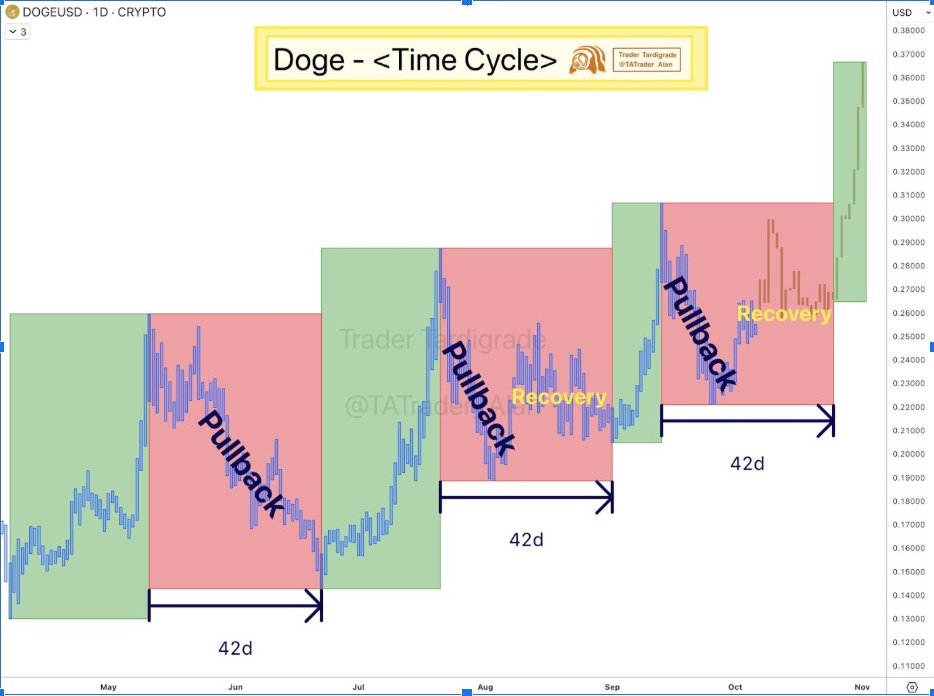
In previous cycles, the DOGE price dropped from $0.22 to $0.19 and then bounced back to $0.28. Historically, this has occurred within a matter of days, with the price reaching $0.33 or $0.35. Tardigrade said that the pattern was indicative of investor confidence returning after each consolidation. He considered the repetitive time pattern as a guide to accumulation before breakouts.
He said that Dogecoin’s persistent trend was a predictable pattern of investor psychology. The trading is to take profits near local highs and re-enter once corrections stabilize. This consistency can be used to determine the beginning of the next impulsive move. Tardigrade believed that the next phase was a good chance to be the strongest of the current cycle.
Parabolic Price Expansion Indicated by Wedge Formation
In addition, market analyst EtherNasyonal believed that Dogecoin price may re-enter another parabolic phase similar to the previous bull runs. His long-term chart was a wedge that had three identical formations since 2017.
Notably, each of the wedge breakouts formed strong rallies, from $0.0002 to $0.018, then from $0.003 to $0.74. The current wedge spans between $0.20 and $0.26, suggesting a similar setup is forming.
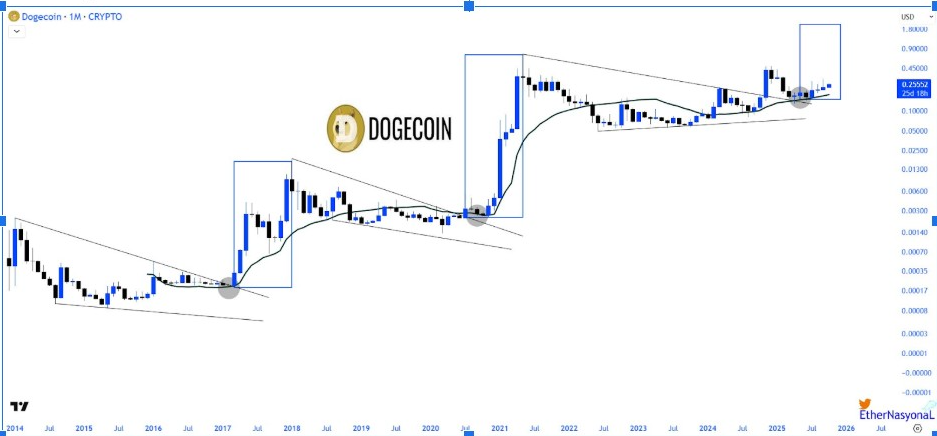
EtherNasyonal set the breakout trigger at $0.35, which could propel Dogecoin to $0.60 and $0.75. Buyers are holding onto strategic levels, as accumulation increases. He said that Dogecoin continuing to trade above its moving average is bullish confirmation. The price expansion will mirror historic momentum phases, but on weakening resistance.
Triangle Pattern Suggests Breakout Potentials
Adding to the overall bullish perspective, GalaxyBTC’s weekly chart depicted a symmetrical triangle with downward resistance near $0.42 and upward support around $0.19. This is the same structure as was seen before Dogecoin explosion in 2021. He said this structure has compression followed by volatility expansion, which is an indicator of directional movement.
Notably, a confirmed breakout above $0.42 would target price levels of $0.60 or $0.75. GalaxyBTC noted that the increased lows on the chart indicate increased demand. The top meme coin tightening range implied a build-up of energy for the next impulsive move. He believed that the breakout could happen if momentum continues into the end of October.
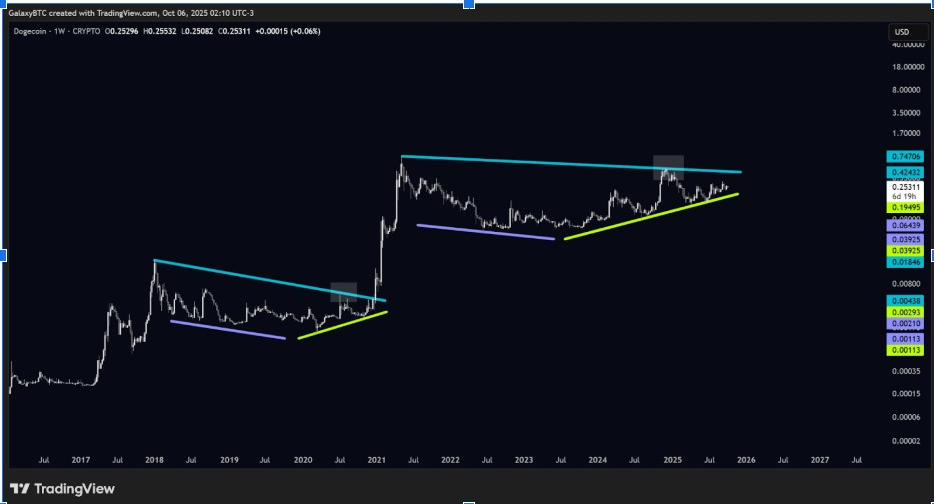
The analyst also mentioned that Dogecoin fractals are repeating over different time frames. The symmetrical structure in previous cycles resulted in exponential rallies. Thus, GalaxyBTC saw the ongoing formation as an extension of the same long-term rhythm, which could soon propel the coin into a new uptrend.
Market Cap Ratio Indicates Increasing Momentum
Moreover, Cryptollica compared DOGE’s market capitalization ratio with the total cryptocurrency market. His DOGE/TOTAL marketcap chart displayed a 10-year downwards channel, which Doge is now testing. This lower boundary historically was the catalyst for some strong upside bounces.
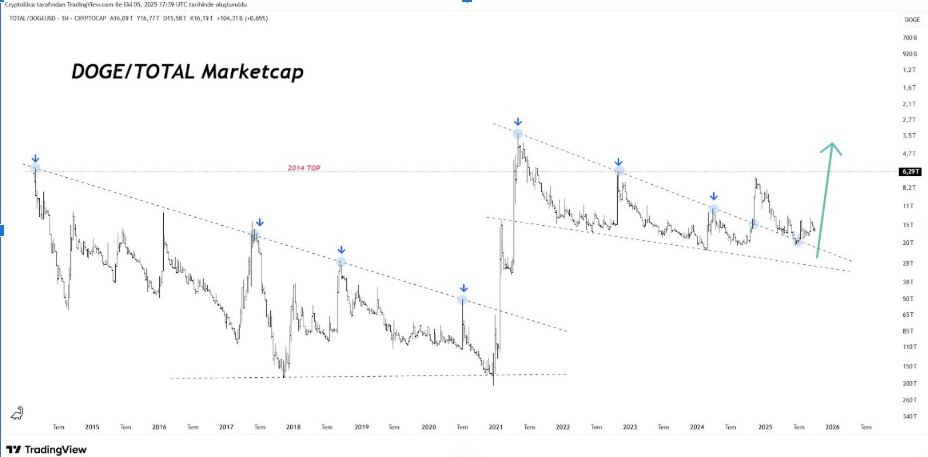
The ratio is now around 0.00047, which is close to the level at which previous reversals occurred. Cryptollica said that Dogecoin price could break out and reach $0.45 or $0.50. The alignment of the market cap indicates growing dominance as altcoin sentiment improves. Once the upper channel breaks, DOGE price performed well for months ahead of the market, as shown by history.



