Wisp
Wisp Doge Pepe
 Zylo Ecosystem
 Crawlerpad
 Pudgy Penguins
 Pearl
Pearl Basic Attention

PEPE price is oscillating sideways after a sharp decline, with analysts split over its next move. The technical charts showed both bullish and bearish patterns around crucial support levels. Traders are now watching to see if price action validates a breakout or prolongs the ongoing decline.
PEPE Price Holds Near Key Support Following Sharp Drop
PEPE price is currently trading at around $0.0000068 after a week of volatility. The meme coin’s structure suggests a pause in the downside momentum, with short-term consolidation occurring near a key support level. The recent move followed several attempts to stabilize the price after it reached the $0.0000066-$0.0000070 area.
Analyst Ali Charts noted that the PEPE price is forming a head and shoulders pattern on the two-day chart. The neckline is at $0.0000066, and a breakdown could send the price towards $0.00000185. His chart also showed several Fibonacci levels in between them: $0.0000047 and $0.0000033 are possible intermediate support levels.
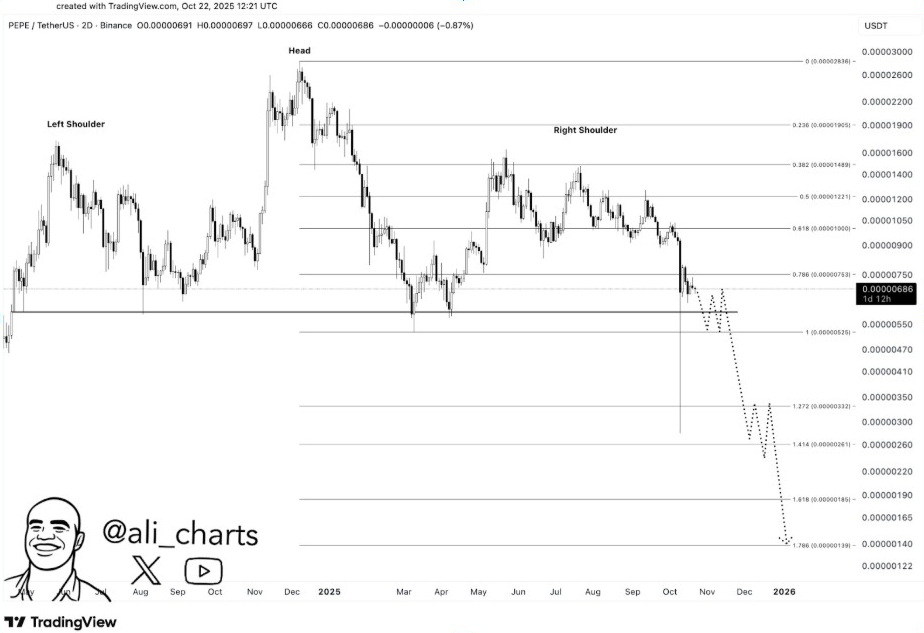
These patterns typically indicate a trend reversal, particularly when accompanied by an increase in volume during the breakdown. However, traders are cautious because the price reactions in this area will likely define the short-term trend for PEPE.
Contradictory Pattern Suggests Possible Reversal
On the other hand, GalaxyBTC displayed a potential inverse head and shoulders pattern on the weekly chart. The long-term support is $0.0000065, which suggests a possible accumulation and not a distribution.
There are similarities on PEPE’s chart to Galaxy’s earlier structure in mid-2024, where a reversal out of this structure triggered a 300% rally. Currently, the neckline is near $0.0000080, so a confirmed breakout above this point could target $0.0000120 and beyond.
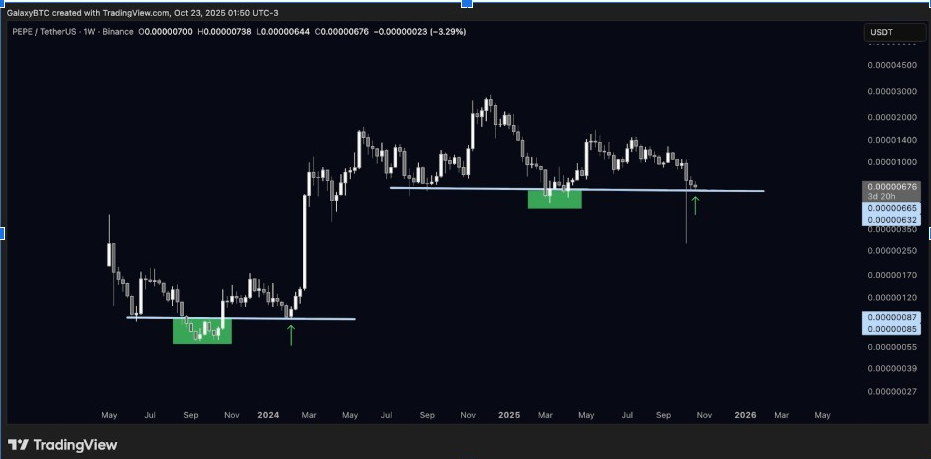
This inverse pattern formation, bearish on the short-term charts and bullish on the higher time frames, reflects a clear divergence in the sentiment of traders. Market players remain cautious, as both scenarios are volume confirmation plays, which require a few more sessions to confirm.
Market Uncertainty Keeps Traders Cautious
In the current price movement, Pepe Whale commented that price has remained sideways within the $0.0000058 to $0.0000052 consolidation since the last decline. He cautioned that these lows could be washed out before any significant bullish move.
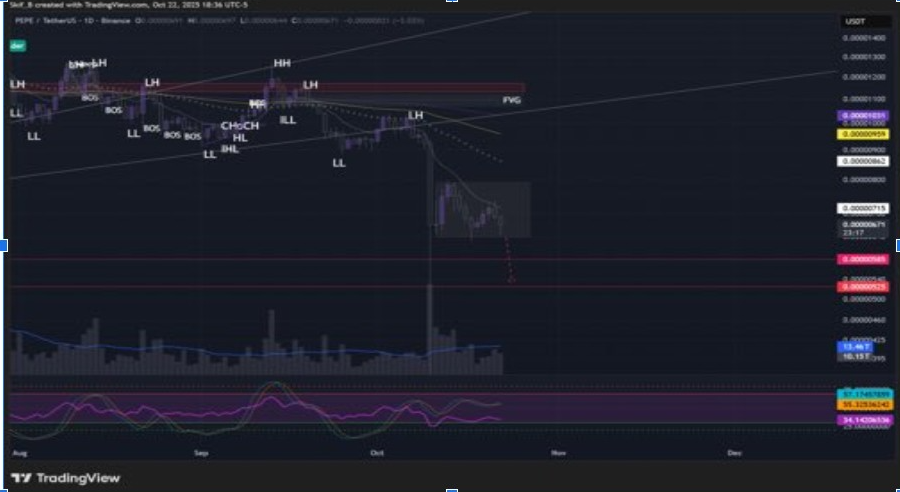
Pepe Whale indicated that shorts who are taken out under these levels can be trapped before a potential rebound. However, he also warned that investors should remain patient despite increased uncertainty. According to him, the safest way now is to wait for a confirmed breakout or long-term accumulation phase.
The low volume and weak momentum on the daily RSI indicate indecision on TradingView. For the majority of traders, the lack of directional confirmation means high risk levels.
Bullish Sentiment Returns Among Long-Term Holders
On the more positive side, another analyst, Nirvan, stated that PEPE price could be setting up for a bullish God candle. He noted that each significant correction produced since 2023 has had support from green demand zones, followed by a strong rally. His chart indicated that the current support level was close to $0.0000062, which also marked the start of the last bull run.
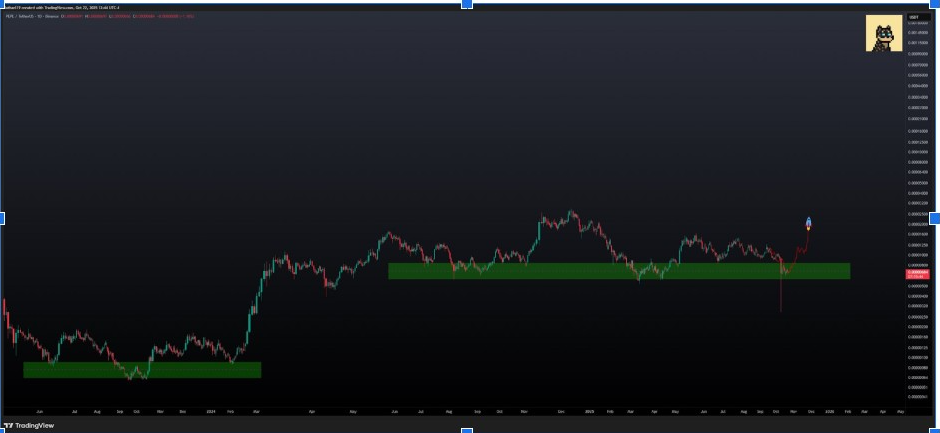
Nirvan called the structure a classic accumulation range, which points to a breakout after the buyers regain confidence. If PEPE price maintains above $0.0000065 with increasing volume, the analyst anticipates the next impulsive wave to begin.
At the same time, the sentiment across the meme coins is split. Some traders are optimistic about the renewed momentum following the return of retail interest, while others remain cautious due to macroeconomic uncertainty and tightening liquidity. The next sessions are likely to decide whether PEPE’s price will confirm Nirvan’s bullish scenario or continue with the current consolidation phase.