
 astronaut
 Pearl
Pearl Hyperliquid
 Walrus
 Pudgy Penguins
 Bitcoin
 NEAR Protocol

Bitcoin hovered near the $100,000 mark on Nov. 5 after a sharp pullback, as traders debated whether the drop reflected weakening momentum or merely a sentiment flush in an ongoing uptrend.
Data from TradingView showed BTC trading around $101,900 after briefly dipping below $100,000 earlier in the day. The daily chart showed the cryptocurrency nearing the lower Bollinger Band, indicating short-term oversold conditions.
Bitcoin BTC Funding Rates Stay Elevated Despite Price Weakness
According to Binance data, Bitcoin’s funding rates remained positive at 0.0085% even as prices retreated from October highs above $125,000. The persistent premium for long positions suggested that traders continued to bet on further upside despite the drawdown.
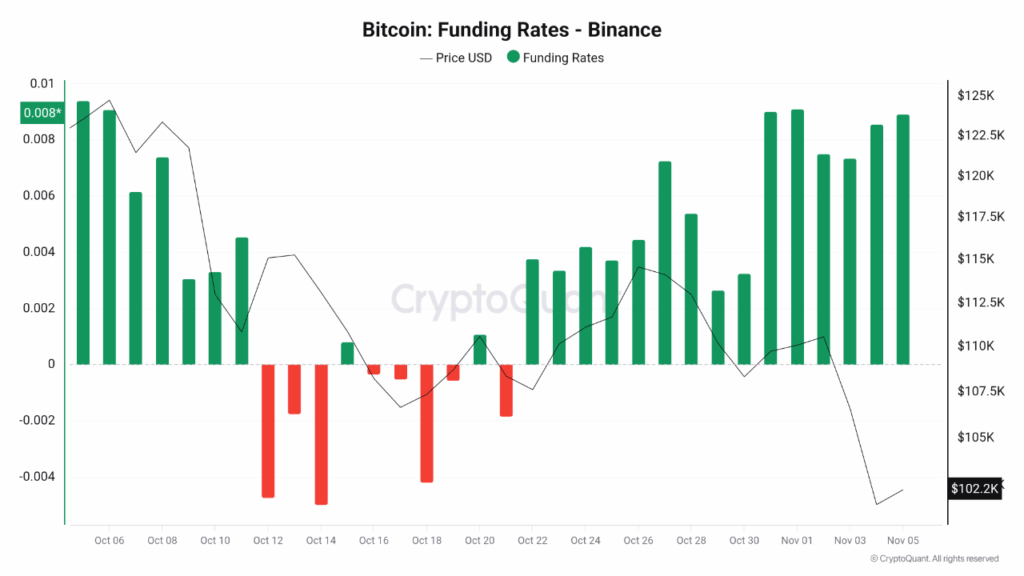
High funding levels typically indicate market optimism. However, when combined with falling prices, they can expose the market to forced liquidations. This mismatch, known as funding divergence, often signals overheated positioning and reduced upside momentum.
Binance’s report highlighted that similar conditions appeared in mid-October, followed by a brief correction, before a recovery once funding normalized. Analysts now warn that a temporary pullback could reset leveraged positions before the broader uptrend resumes.
Analysts Call It “Sentiment, Not Fundamentals”
Crypto analyst CryptosRus argued that the current selloff reflected emotion rather than structural weakness. “Bitcoin’s drop below $100K looks scary, but the data says otherwise,” the analyst posted on X.
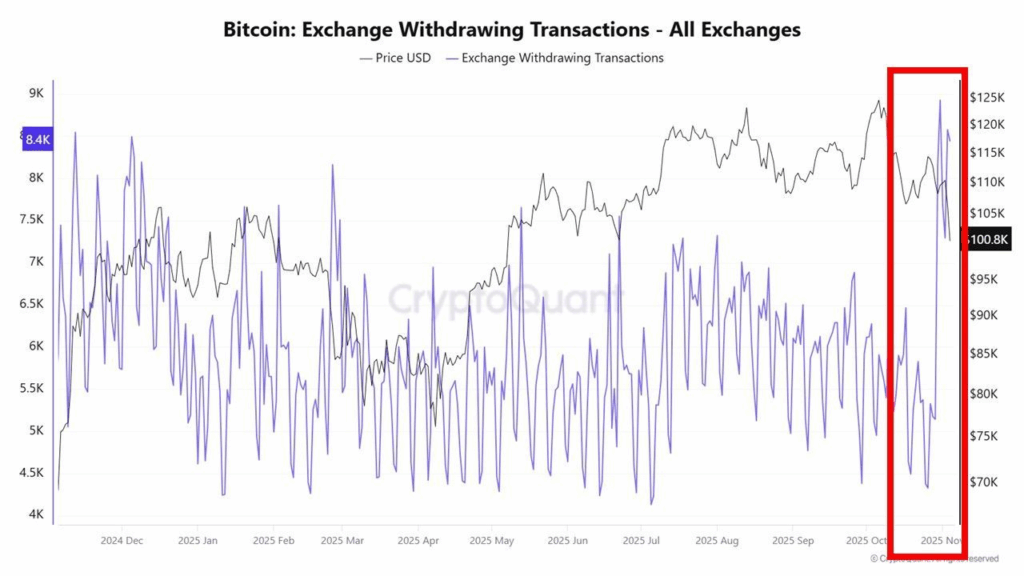
He pointed to multiple bullish indicators: self-custody withdrawals spiking, only 12% of unspent transaction outputs (UTXOs) currently in loss, hashrate remaining near record highs, and stablecoin inflows rising again.
“The network hasn’t blinked,” he said, emphasizing that the Fear & Greed Index’s fall to 21 merely mirrored shifting trader sentiment, not a breakdown in fundamentals.
Market data supported his point. Despite the correction, on-chain activity remained steady, and miner reserves showed little change. This suggested that large holders and miners continued to view current levels as part of a healthy market rotation rather than the start of a major downturn.
Historical Support Meets Bullish Precedent
Coin Bureau noted that Bitcoin had touched its 50-week moving average a technical level that, in past cycles, preceded major rallies. “Every time BTC retested this line, it eventually reached a new all-time high,” the account stated.
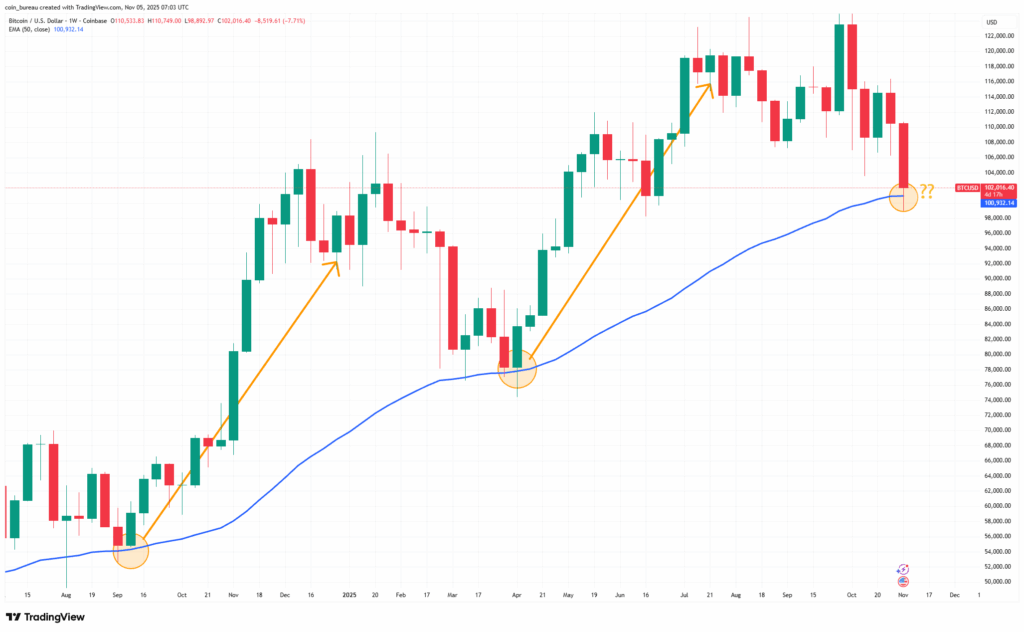
The 50-week average now sits near $101,000, aligning with current price action. Previous spikes occurred in September 2024, when BTC surged 99% to $109,000, and again in April 2025, when it rallied 50% to $125,000.
With the latest retest, analysts speculated that Bitcoin could again prepare for an upside reversal if macro conditions remain stable. The setup also coincides with cooling leverage and reduced short-term volatility, both of which often precede trend resets.
Bitcoin BTC Market Mood Shifts as Bulls Regroup
On-chain and derivative data pointed to cautious optimism. Exchange reserves continued to decline as investors moved holdings to cold storage, while stablecoin inflows on major exchanges like Binance and OKX suggested renewed buying power.
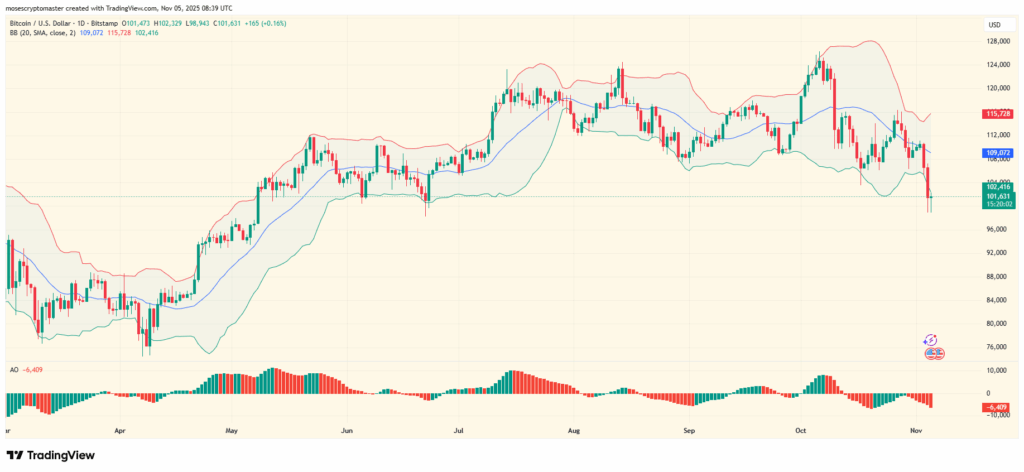
The Awesome Oscillator on daily charts displayed persistent red bars, albeit with decreasing intensity, suggesting that bearish momentum might be waning. Bollinger Bands remained wide, reflecting high volatility potential but also room for a rebound if buying returns.
Funding divergence and emotional market reactions dominated short-term sentiment. Yet, the broader technical structure, anchored by long-term averages and network resilience, remained intact.
BTC’s behavior “mirrors early-cycle shakeouts” typical of pre-rally consolidations. The persistence of positive funding and declining exchange balances added weight to the view that large investors were still accumulating.
Conclusion
Bitcoin’s struggle around the $100,000 level underscored growing tension between speculative leverage and fundamental strength. Elevated funding rates and a fearful sentiment backdrop hinted that the market could experience more volatility before direction clarity emerges.
However, historical patterns and underlying network data painted a more balanced picture. As Coin Bureau highlighted, the 50-week moving average has repeatedly marked turning points for Bitcoin in previous cycles.
BTC’s next move depends on whether traders interpret this latest drop as a correction within an ongoing bull phase—or the first test of conviction before a larger rally.



