Bitway
 Pearl
Pearl Zylo Ecosystem
 Walrus
 Derive
 Pudgy Penguins
 Arbitrum

ZCash (ZEC) surged by more than 17% in the past 24 hours, surpassing the $500 mark last visited in February 2018. Overall, the privacy coin has been up by more than 3,000% since 2024 lows. ZEC traders were becoming more bullish as the altcoin continued to rattle up.
The move was accelerated by whale activity, which was longed during the small pullbacks this week. Although the price action remains bullish, the TD Sequential indicator has triggered a sell signal, which puts the rally at risk.
Whale Profiting from ZEC Trade
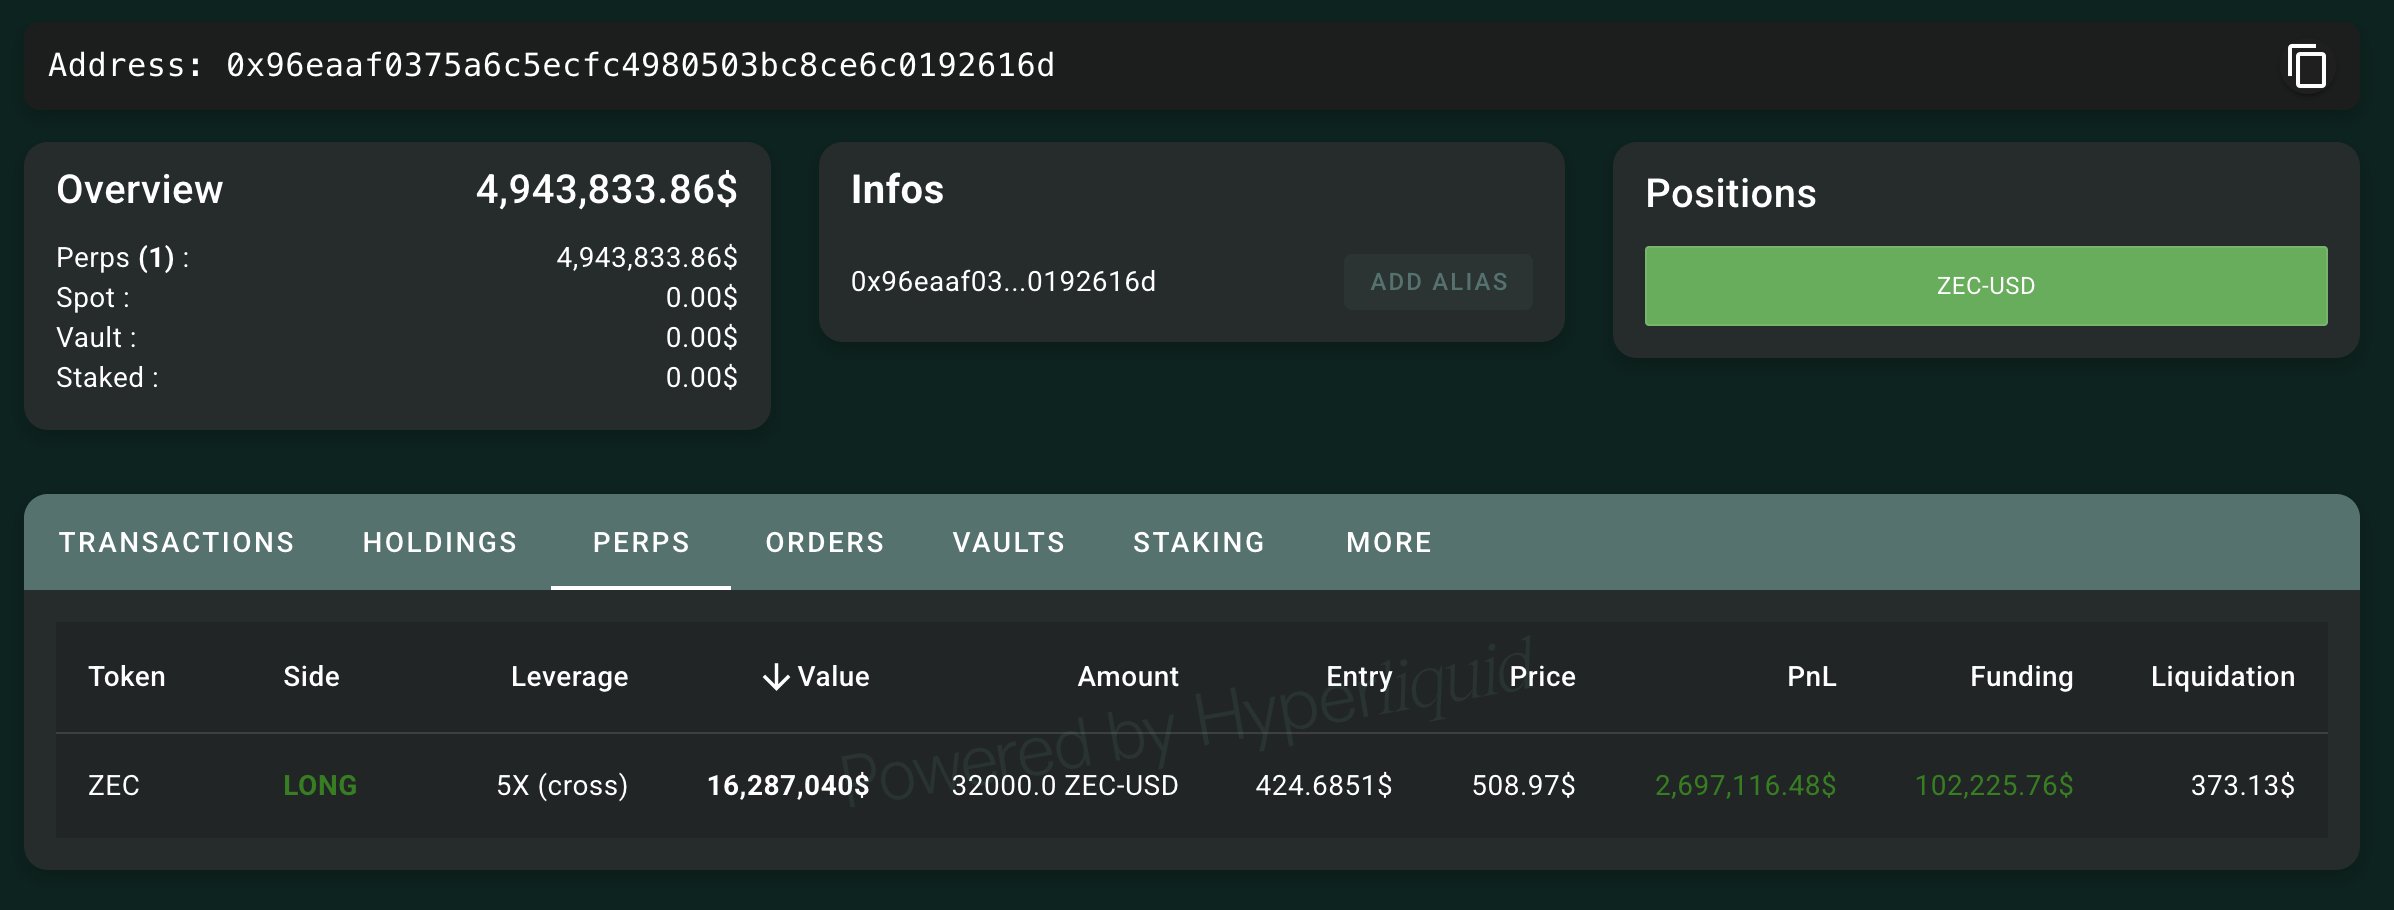
As per Lookonchain, a new wallet that was only three days old went long on ZCash price, with an entry at $424 and 5x leverage. The trader bought 32,000 ZEC valued at $16.29 million with a floating profit of $2.70 million and a liquidation price of $373.
The move accelerated ZCash price to rise past $500, with the valuation at $535 when writing. More buying from other whales would push the price higher.
The performance of ZCash price since the start of September has been robust, registering three monster candles. Bulls, including BitMEX founder Arthur Hayes, are still holding their coins with their eyes set at $1,000 or higher.
ZEC Price Soars By 3,000% Since 2024 Lows
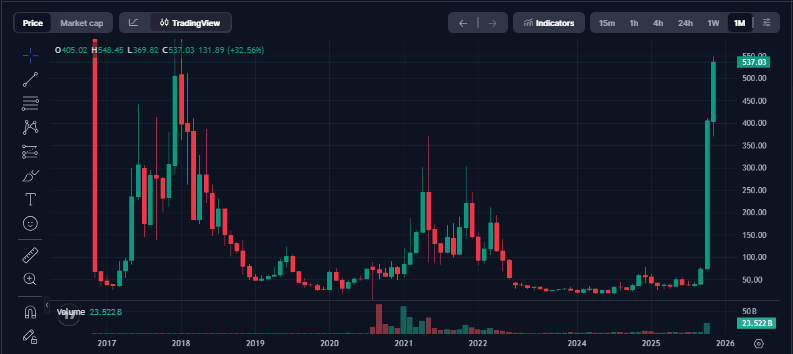
Key details of the performance of ZCash price displayed immense gains when accounting for the period since the 2024 lows. ZEC price has gained over 3,000% since its lows of 2024, surpassing $500, a level last visited about 2,830 days ago.
This midterm performance coincided with a 17% rise in the price of ZEC. The monthly timeframe chart showed that October 2025 was the best performing since 2018, with the surge starting in September. November seemed to be intensifying these gains.
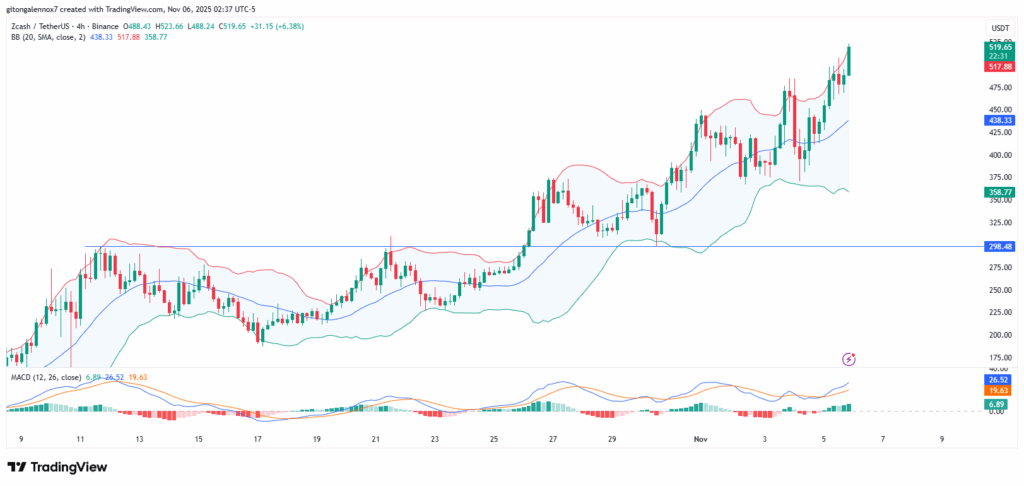
While the altcoin was attempting to breach the 2018 highs, its price action on the 4-hour chart was indicating a strong market. However, there was a problem, but what was it?
Does The TD Sequential Signal Put The Rally At Risk?
On the charts, Zcash‘s price action established a strong uptrend characterized by higher highs and lows. This momentum of the outlook was backed by the MACD, which was in the green zone. Additionally, the Bollinger Bands (BB) were open, indicating the volatility of the ZEC cryptocurrency.
The chart showed that the whale who FOMOed the ZEC trade during the pullback seen on November 3rd. This was when the price of Zcash broke below the midpoint of the BB. The next price target was $947, or roughly $1,000, coinciding with the 2018 high.
However, the rally seemed to be at risk, as the TD Sequential indicator flashed a sell signal, according to a chart analysis by Ali Charts. Over the past few months, it had predicted these short-term market turns with outstanding precision. The same could be true, as it hinted of a looming pullback like one seen in the past three days.
In conclusion, the structure of ZCash price remained bullish, though the signal hinted at a potential short-term pullback. This could be a great zone to accumulate if the trend were to continue, while also noting the risk involved with such extended markets.