
 Puffer
 Bitcoin
 ZKsync
 NEAR Protocol
 Walrus
 Pearl
Pearl Ondo
Ondo

Ethereum price is facing strong on-chain resistance at the price of 3,700. According to Glassnode, as of November 5, 2025, more than 868,766 ETH were held in the range of $3,662 to $3,678. These holdings indicate a thick wall of supply that will be a barrier to raising the supply.
The heatmap shows the recurrence of the price ceiling in the region of 3,700. During late September and October, Ethereum has hit this level multiple times.
However, it has not been able to stay above it. This indicates that there is still selling pressure by investors who are out to break even.
The constant rejections affirm that $3,700 is a critical support level. A significant number of the holders might divest their holdings as soon as the price returns to the region.
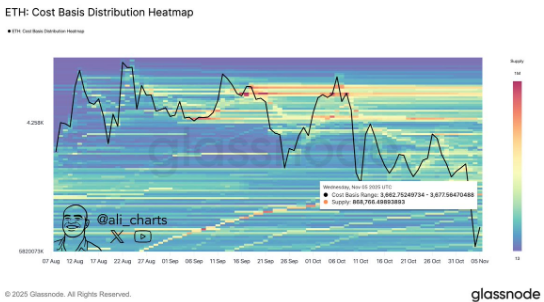
This on-chain trend is consistent with the Ethereum price since the beginning of August. This is where each increase above the price of $3,650 has been absorbed by the supply. The cost-basis cluster is therefore a measure of psychological and structural resistance.
Ethereum Price Hovers Around $3,400 as Traders Watch for Breakout Confirmation
Ethereum price is trading at around $3,414. It is in a narrow range between $3,700 and $3,150 as depicted on the daily charts. The chart highlights several rejection areas in red between 3,620 and 3,700.
This supports the on-chain resistance found by Glassnode. A resounding conclusion above these levels would be back to the positive. However, failure to clear them would spell a retest of the lower supports.
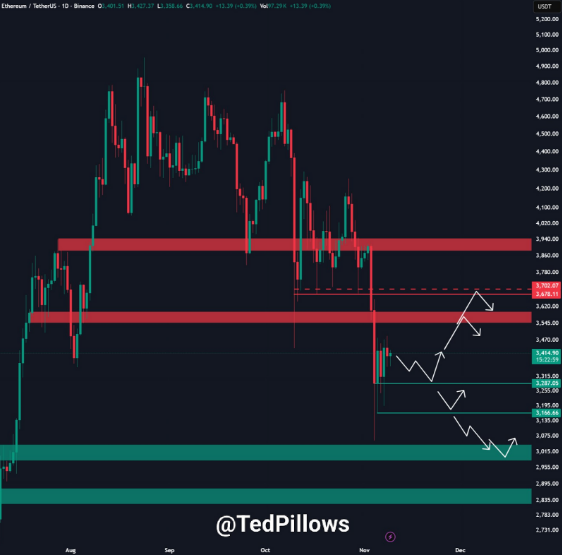
There are essential intermediate support points of $3,285 and $3,150 according to the chart structure. If these levels hold, the Ethereum price may stabilize and then attempt to retest $3,600.
Nevertheless, a persistent decline of less than $3,150 may pave the way for the next liquidity pool. It is expected to be between 2,900 and 3,015. The range holds previous demand bands.
This merger is based on a turbulent October. Ethereum briefly surpassed the $3,900 level. Then, it quickly dropped during the month.
Weekly Chart Targets Highlight Long-Term Resistance Zones on Ethereum Price
Analysing from a broader technical perspective, the long-term charts present possible retracement and extension levels using the ETH/BTC ratio.
Ethereum price is testing the volume shelf at approximately $3,200-$3,400. This is a high-traffic spot where significant volume was conducted in the past cycle.
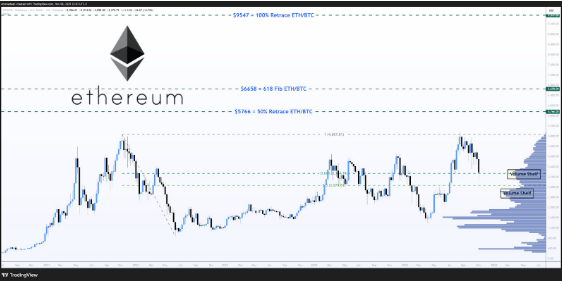
The weekly chart also indicates that ETH has adhered to its long-term pattern since the bear market bottom of 2022-2023. Every significant rebound created higher lows.
The drop from the $4,867 high in mid-2025 signals fading momentum. Without a fresh catalyst, sustaining growth will be difficult. The overall uptrend remains in a holding pattern until the price returns to the mid-range resistance of around 3,700-3,900.
To supplement the price structure, the protocol revenue data, according to Artemis, indicate a significant slowdown. By early November, Ethereum had earned $475,000 in network revenue.
This represents a 63.9% drop since the network reached its high in early October. This reduction is an indicator of low activity, as evidenced by the decrease in transaction fees and token burns. This is a measure of low block space demand.


