Puffer
 ZKsync
 Bitcoin
 NEAR Protocol
 Pearl
Pearl Quantus
 Sui
Sui

Chainlink price has dipped towards a multi-year trendline that has been a defining feature of its broader market structure since early 2023. The move comes after weeks of steady selling that saw LINK move towards levels not seen since the previous cycle resets. Analysts now recognize this trendline retest as a decision point that could establish the trend for the next few weeks.
Chainlink Price Retests Critical Trendline Support
Analyst Ali Charts highlighted the long-term trendline that has provided support to LINK for almost 2 years. The level is close to the $14 zone and has seen several rebounds since mid-2023. LINK price is now retesting this same diagonal support after a persistent decline in November, making this level one of the most critical levels on the chart.
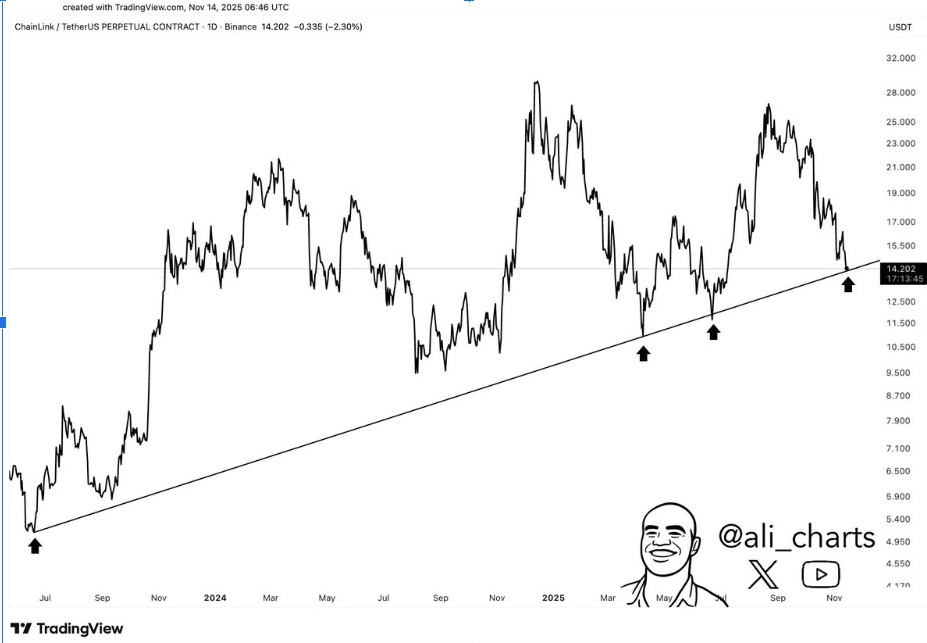
Ali said the previous reaction from the trendline often led to strong recoveries, resulting in new higher highs. He now doubts whether the structure will stand the current selling pressure. LINK traded around $14.20 when the trendline was touched again, suggesting the beginnings of a hold.
However, he said a breakdown could pave the way for $12, an area with limited demand. The analyst said the subsequent sessions will show whether the buyers still defend the diagonal boundary.
Ali’s chart also indicates consistent symmetry between previous rebounds and the current test. This implies that the market still respects the structure despite the recent fall. If buyers return, LINK may try to move towards $15.50 and $16. If not, downward volatility could pick up in lower-liquidity zones.
Downtrend Channel Signals Growing Market Pressure
Similarly, analyst Don pointed to a steep falling channel that LINK followed since August. His chart showed LINK price trading at the lower boundary of the channel, a region that often attracts speculative buyers during extended downturns.
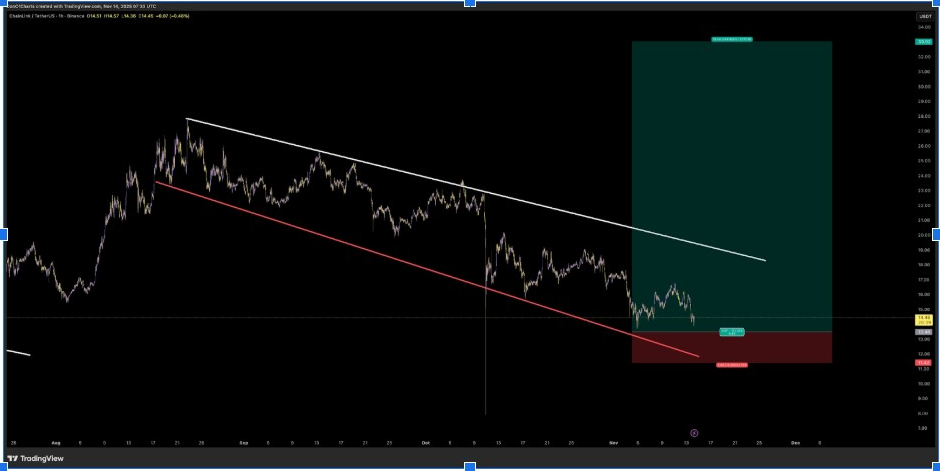
He displays a massive upside risk-reward area above the current price. According to him, the setup becomes attractive if LINK breaks above the upper channel line, which has capped every rally for almost four months. The lower boundary aligns with Ali’s trendline, thereby increasing the current test’s significance. This overlap creates a stacked support region, which is rarely seen in recent cycles.
His analysis puts early upside targets between $23 and $30, but only after a confirmed breakout. Don emphasizes the importance of structural changes before any bullish conviction is built. If LINK breaks the bottom of the channel line, the next supports are near $13 and $12.50. His model suggests volatility will be high until Bitcoin settles.
Key Support Levels Shape the Short-Term Outlook
Trader CryptoWZRD noted that both LINK and LINKBTC printed bearish daily closes, indicating the trend’s exhaustion is evident. He points out that LINK can no longer find support below $15.40, which has been intraday resistance in every attempt to rebound.
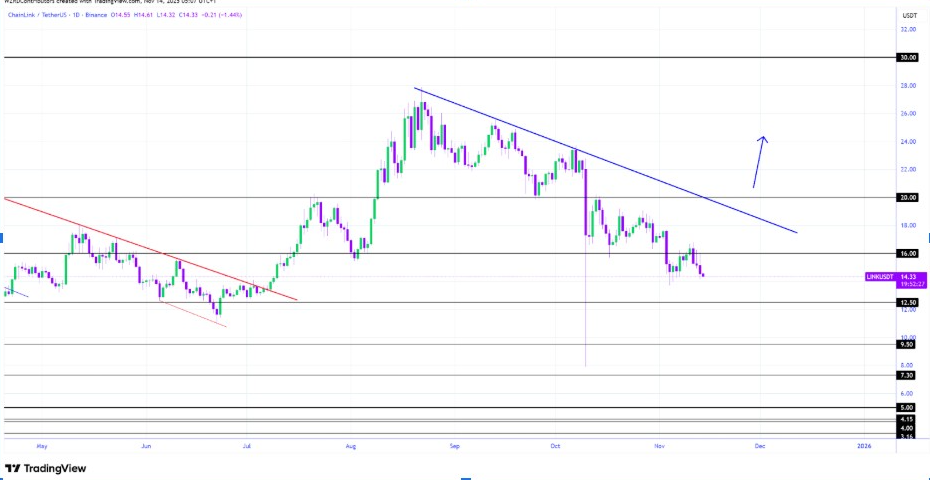
WZRD identified $16 as the level required for any near-term recovery. He maps support at $12.50 and $13.50, which are the next downside targets should selling pressure persist. The analyst looks for sideways action until Bitcoin shows a clearer trend change, as current volatility remains tied to broader market reactions.
He also emphasizes caution, noting that the intraday structure remains tilted toward lower highs and lower lows. LINK would need several good candles to form above the trendline to reverse that trend. Until then, the market may remain in a consolidation phase with intermittent volatility.
Exchange Reserves Fall as Whales Accumulate LINK
Meanwhile, Crypto Panda reported a significant collapse in LINK exchange reserves during the year. His chart shows reserves reducing from almost 180 million tokens to about 132 million. This massive decrease implies continued accumulation of whales as traders withdraw tokens into long-term storage.
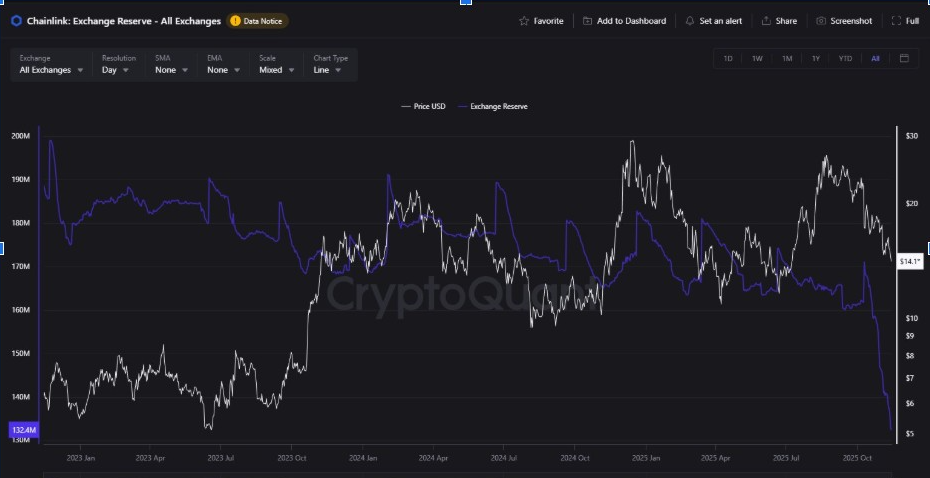
The fall in the exchange supply is often an indication of reduced selling pressure. However, Panda adds, retail traders still sell into weakness, creating a mixed environment. The current price near $14.10 reflects the conflict between long-term holders and short-term traders. He says supply tightening could help LINK once the market sentiment improves.
Critical data from Panda adds a basic layer to the technical story. If accumulation continues, LINK may stabilize above the multi-year trendline. But if sentiment weakens further, in the short term the impact of whale activity could be overshadowed by panic selling.