Wisp
Wisp Doge Pepe
 Crawlerpad
 Zylo Ecosystem
 Pearl
Pearl Basic Attention
 Quantus

Sei (SEI) price is showing indications of a possible market bottom. Analyst Ali Martinez shows a new TD Sequential buy signal on the monthly and weekly charts. These signs indicate that the previous decline is slowing down as SEI trades in the highest areas of 2025.
The bi-monthly chart marked a 9 buy signal at about $0.15. This is the first in a long time since the beginning of 2024.
SEI price had a cyclical low around the same area. The weekly chart also demonstrates the same trend, as a new TD 9 emerged following a series of decreases that moved prices back to the previous middle of the 2023 demand range.
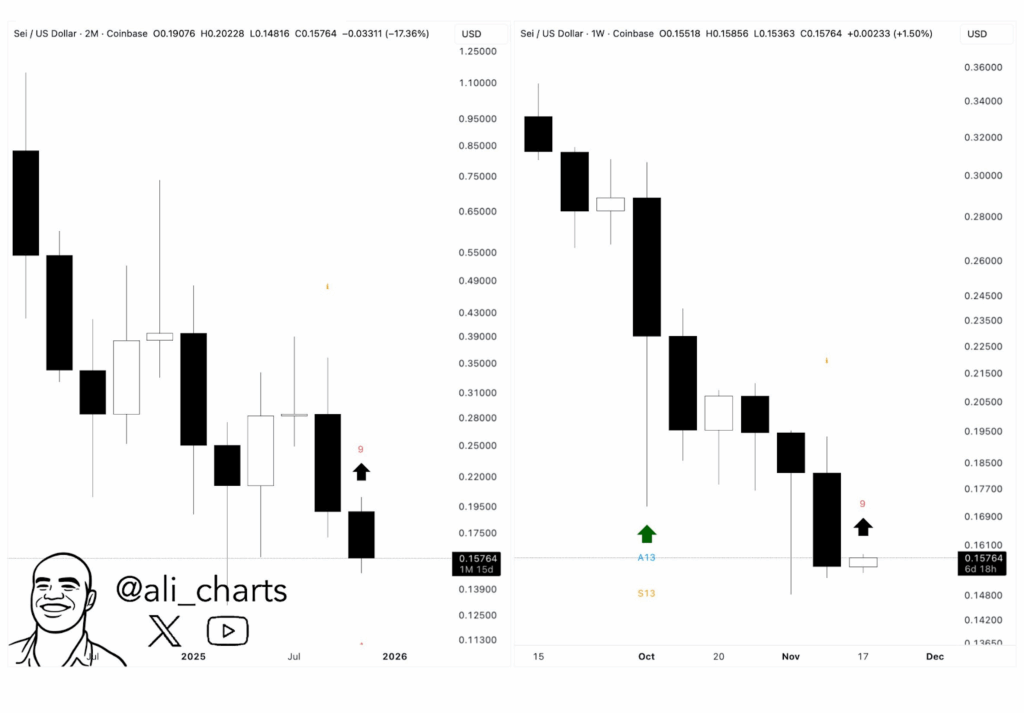
These convergences place SEI at a historical turning point where past declines had leveled off and were followed by mid-cycle rallies.
Sei Price at Critical Support
The $0.15-0.16 region served as the structural floor during accumulation phases earlier in the cycle. Sei price is currently within a support block. Multi-month dips at the end of 2023 and at the beginning of 2024 also caught this support.
The Sei crypto price is trading below the 200-day EMA, which currently stands at $0.34. This zone currently serves as a major breakout level of SEI. The 200-day trendline has served as the long-term resistance since the April 2025 rejection.
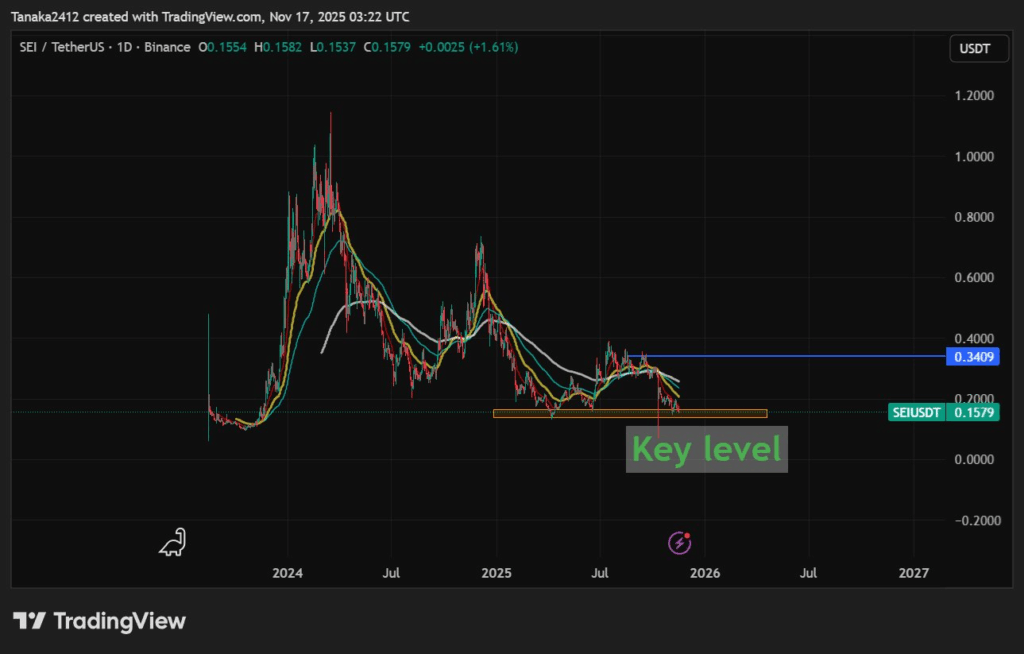
The chart also indicates that there have been several wick rejections towards the levels of $0.153-0.158. These rejections indicate interest from buyers, despite the overall softness of market sentiment.
Open Interest Tilts Bullish as Longs Dominate 60% of Volume
The case of potential bottom is enhanced by perpetual market positioning. On-chain data shows that the long-to-short ratio was 60:40. The total volume of long was approximately 766,000 among 57 traders. Short positioning is approximately 495,000 divided among 43 traders.
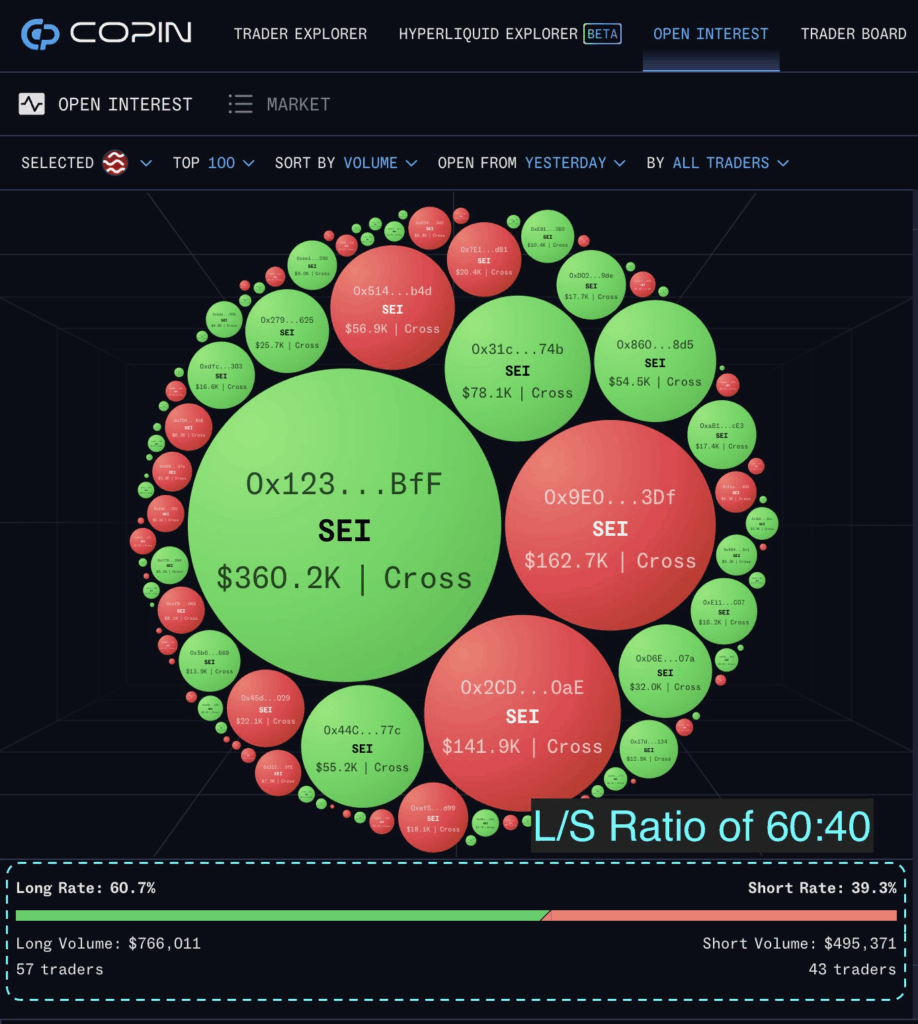
Even the individual large position of over 360,000 is larger than any single short allocation. Such a level suggests the readiness of the bigger traders to assume directional exposure at current levels.
Although the change to long dominance is not yet a direction-determining factor, the transition to long dominance is in tandem with the high-timeframe TD buy signals. The concentration of price in an established support base.
Historical Structure Shows SEI Price at a Pivotal Moment
More Sei price charts indicate an old-term falling wedge, which started to form after the peak of April 2024. The same structures had breakouts in the early months of 2024 and mid-2025. They resulted in large expansions after SEI had regained horizontal resistance levels.
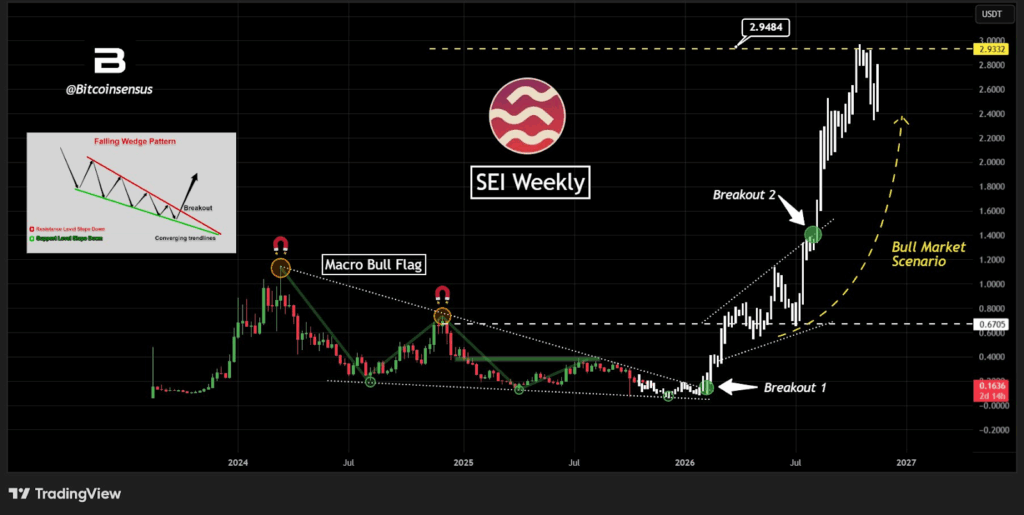
SEI price is currently at the lower end of the wedge. The positioning coincides with the same support level indicated on the daily chart. It has been the base of previous trend reversals in this area.
The long-term overheads have been steady. The initial major horizontal line is close to $0.67, with a macro resistance zone at $1.40. These levels coincide with historical breakout points, and SEI has entered into accelerating trend phases.
A long-term bullish picture would have the upward potential to reach the $3 point. However, this zone served as a historical resistance zone.
A move toward the 200-day EMA at $0.34 would be the first step in reversing the broader downtrend. However, failure to maintain current support would invalidate the bottoming structure.