
 NEAR Protocol
 Pearl
Pearl Bitcoin
 Puffer
 ZKsync
 Pudgy Penguins
 Hyperliquid

Bitcoin price is facing renewed pressure after it broke below a number of short-term support zones. Selling has been accelerated as market sentiment has weakened across the major sectors of the crypto space. Analysts are now pointing to key levels of confirmation that can determine whether the decline will be a deeper structural correction.
Bitcoin Price Tests Major Support as Trend Weakens
Bitcoin price is now pushing into a key support cluster after a strong pullback over the last few weeks. The move comes after a series of bearish signals across higher time frame charts, including a fresh sell move on the weekly SuperTrend.
Ali noted that the SuperTrend has been used to mark major cycle tops reliably for over a decade. Each time it went bearish, as the weekly chart indicated, Bitcoin had a large, multi-month correction.
His chart showed identical signals in 2014, 2018, and 2021, all of which were followed by deep declines. The new sell trigger suggests that a similar structural phase may be forming again.
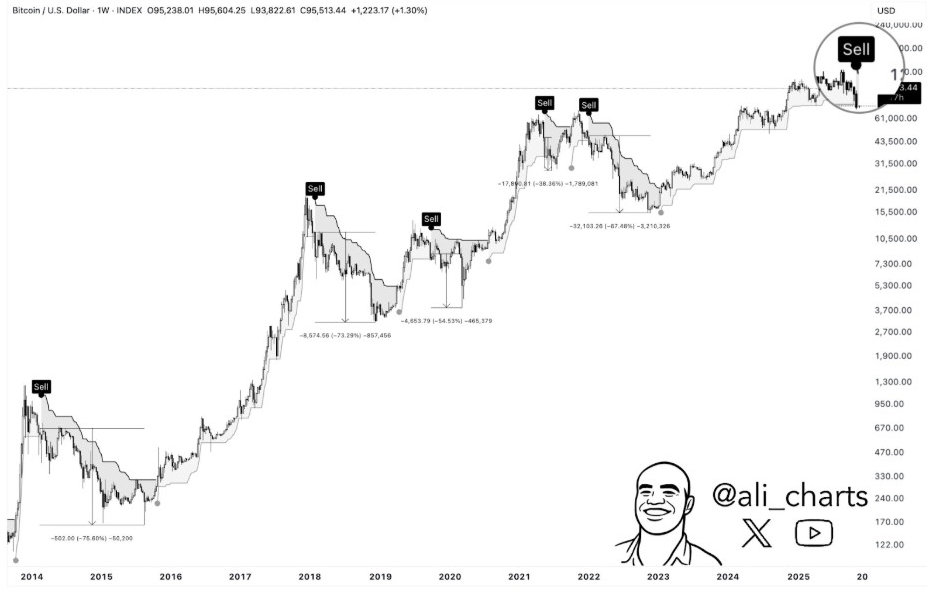
Ali noted that previous SuperTrend flips had generated corrections ranging from 38% to 75%. Protracted rallies with exhaustion patterns preceded these declines. The top cryptocurrency is now responding in the same way after months of high prices and declining momentum. Traders are paying close attention to the current zone to see if buyers come to defend the structure.
RSI Collapse Signals Panic Conditions as Selling Deepens
Similarly, Cas Abbe pointed out that the daily RSI of Bitcoin is at its lowest reading since Q3 2025. He added that selling pressure is unusually heavy, reminiscent of previous flushes driven by panic. Historically, oversold readings of the RSI have been followed by relief bounces, but Abbene says this sell-off looks “structural.”
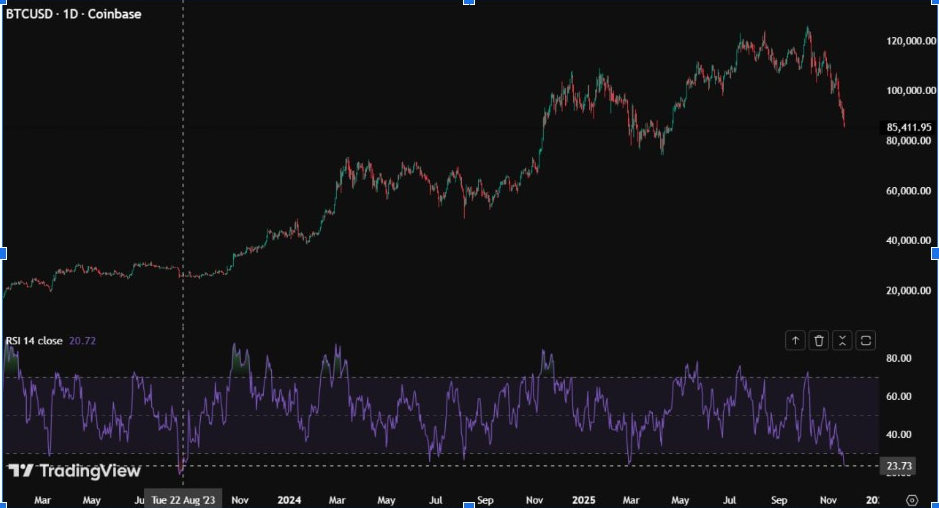
His chart illustrated the RSI dipping close to the 20 level, which is similar to previous extremes seen in capitulation-style moves. The downtrend is based on signs of strong momentum exhaustion as the price rejects numerous resistance levels. Abbe suggests that markets tend to bounce back after intensive declines, but only if there are no other catalysts that spoil the sentiment.
Furthermore, ETF data reinforced this view. Wise Advice reported $903 million net outflow from spot Bitcoin ETFs, the second-largest net outflow ever seen. Heavy withdrawals tend to increase short-term volatility.
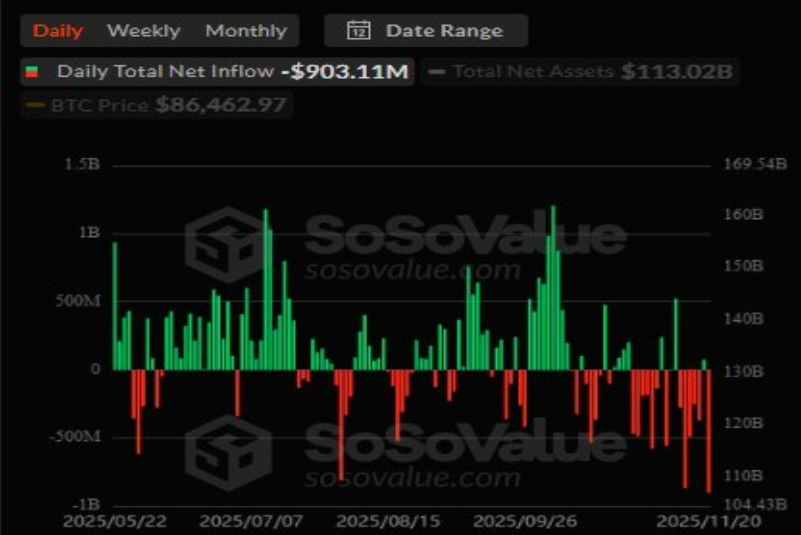
The outflows also suggest risk reduction among the institutional holders, putting pressure on an already fragile market. Bitcoin investors have now begun paying attention to whether the ETF flows calm down before the broader picture worsens.
Oversold Signals Grow as Long-Term Cycle Cyclicality Emerges
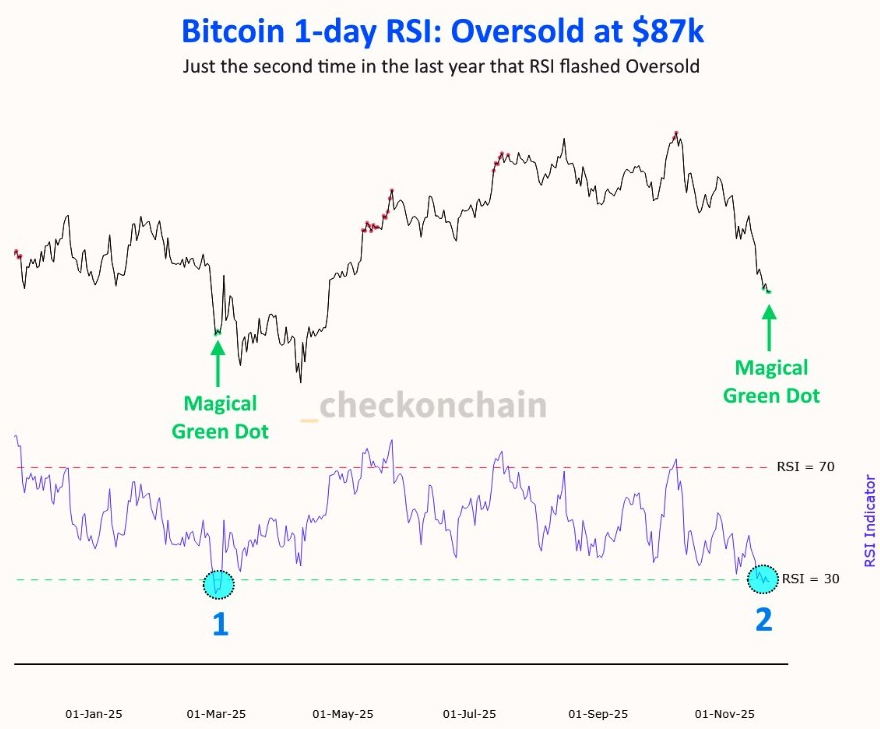
Frank saw fresh oversold conditions on the one-day RSI, the second time only this year. His analysis revealed a historical pattern in which these “magical green dots” coincided with strong rebounds. The indicator is now showing extreme selling, which hints at possible stabilization once conditions improve soon.
Noodles provided a more cyclical explanation. He argues that the four-year cycle of Bitcoin has not disappeared, but rather it has evolved its structure. He described the way the modern markets bring earlier peaks, faster rotations, and smoother corrections.
His analysis commented that institutional activity has altered the dynamics of volatility. Instead of explosive tops, cycles now change gradually as professionals take leading places.
Noodles added that Bitcoin still reacts to supply shocks created by the Bitcoin halving. However, price discovery takes place earlier due to the faster actions of market participants. He said this current decline fits this updated structure. As cycles get compressed, earlier corrections are more common, particularly after extended rallies. His view places the current drop in a broader context rather than an isolated event.
Rising Wedge Breakdown Points to $65K – $75K Retest
Meanwhile, Don gave a breakdown on Bitcoin’s rising wedge structure. He noted that the rising wedge has now fully played out, with price breaking down from the pattern. The failure is in line with a textbook bearish continuation, especially after repeated rejections near the upper trendline of the wedge.
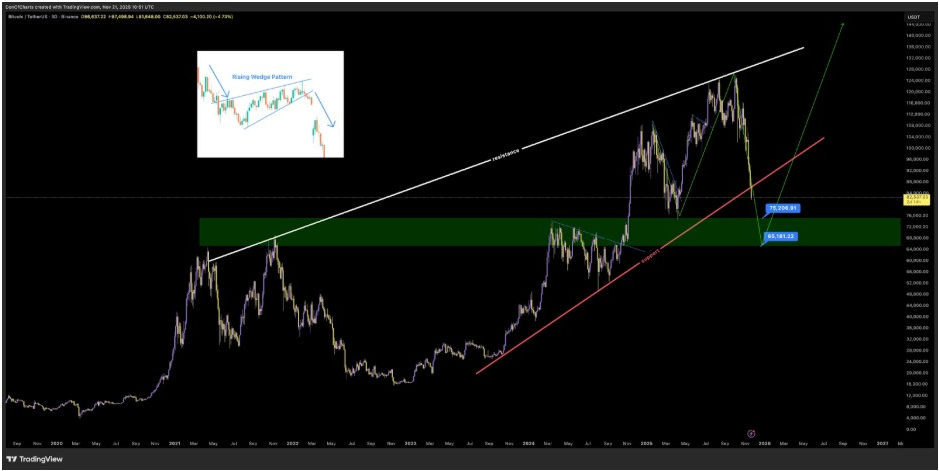
Don pointed to a major support zone between $65,000 and $75,000. He said in many cases, institutions wait for deeper entries into such zones. His chart showed previous reactions from this range during earlier phases of consolidation.
Don believed the pullback was healthy and reset the market structure. He added that bullish conditions are intact as long as Bitcoin is above the green zone.


