streamoors
 IGNITION
 Injective
 NEAR Protocol
 Pearl
Pearl LayerZero
 Hyperliquid

Dogecoin price is showing early signs of strength after being under heavy pressure over the previous weeks. Several technical signs are pointing to a possible change of direction. Analysts point to new signals that may affect the next stage of the DOGE price trend.
Dogecoin Price Receives a TD Sequential Buy Signal
According to Ali, a fresh TD Sequential buy signal formed on the three-day chart. The previous signal triggered a significant rebound, resulting in a 101.50% move. His chart has a similar setup forming after a long downtrend.
Since the indicator often points to levels of exhaustion, traders now watch for possible reactions in the next sessions.
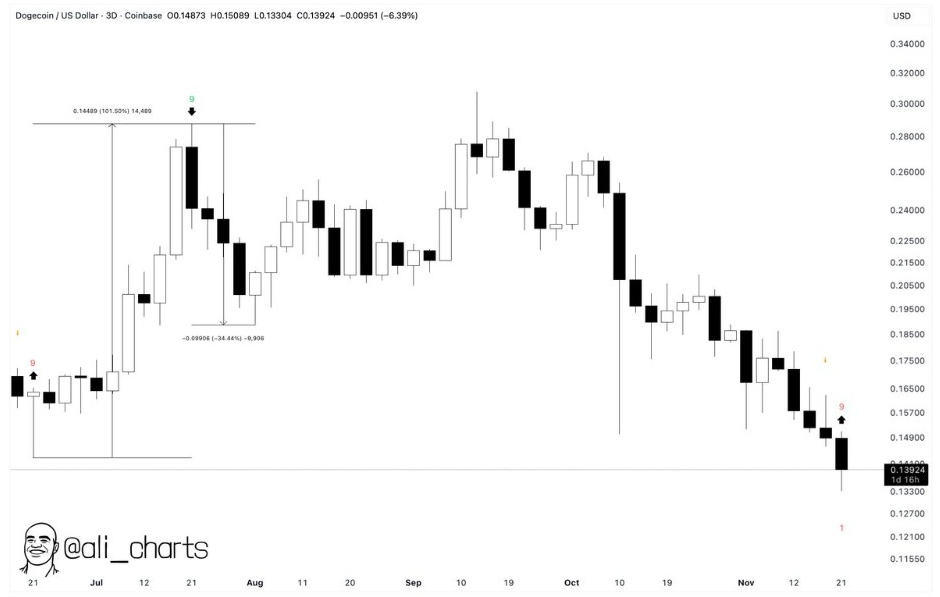
Ali said Dogecoin price is around a critical point where sentiment can flip. The TD 9 candle had finished after long selling pressure. That sets the conditions for a bounce. However, wider confirmation is still required.
Until the price recovers previous resistance zones, buyers are cautious. The signal, therefore, represents an early warning about a possible trend reversal rather than a confirmed trend reversal.
Accumulation Structure Suggests Wyckoff Phase Shift
A wider-structure view provided by Trader Tardigrade with a large Wyckoff Accumulation pattern on the three-day chart. He explained that the DOGE price has moved through the phases A and B since the peak of 2024.
Price recently moved into Phase C, which is the “Spring” action in classic Wyckoff theory. This phase usually forms the lowest part of the structure.
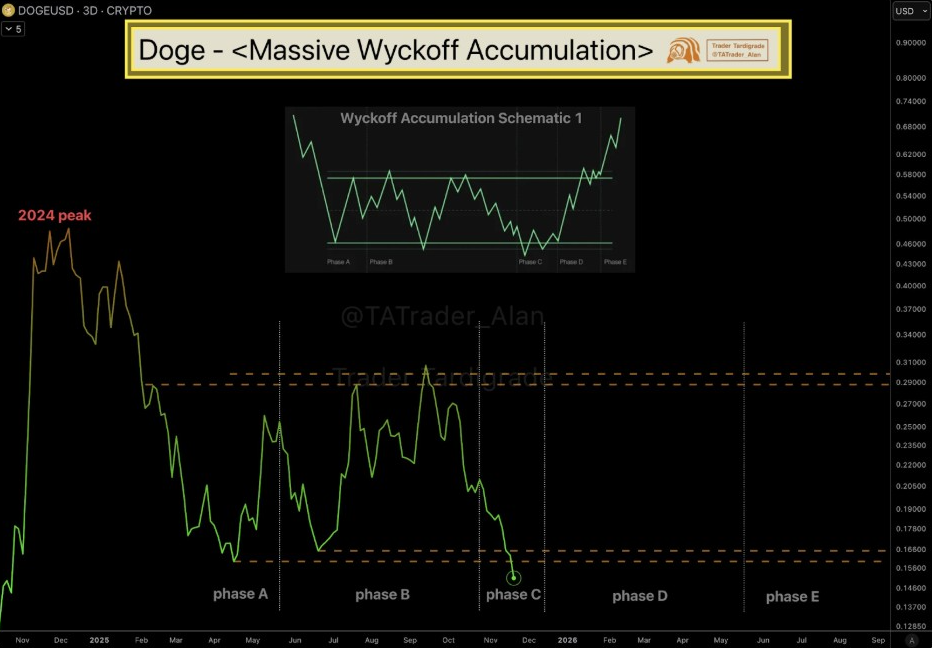
According to Tardigrade, Phase D should take Dogecoin price to the top of the horizontal range. This would challenge the main resistance band made earlier in the cycle. Ultimately, Phase E would fill out the pattern with a breakout above the range.
Because the sentiment has been so weak for months, this accumulation view brings a contrasting longer-term view. Still, there must be a significant improvement in momentum before higher targets kick into force.
Short-Term Charts Show Breakout Signs
Analysis of short-term charts also showed improving conditions. Trader Tardigrade pointed out a breakout from an ascending triangle on the H4 chart. The formation was created after several higher lows were established during multiple sessions.
Since continuing patterns often indicate strength, traders are now watching for the possibility of continuations.
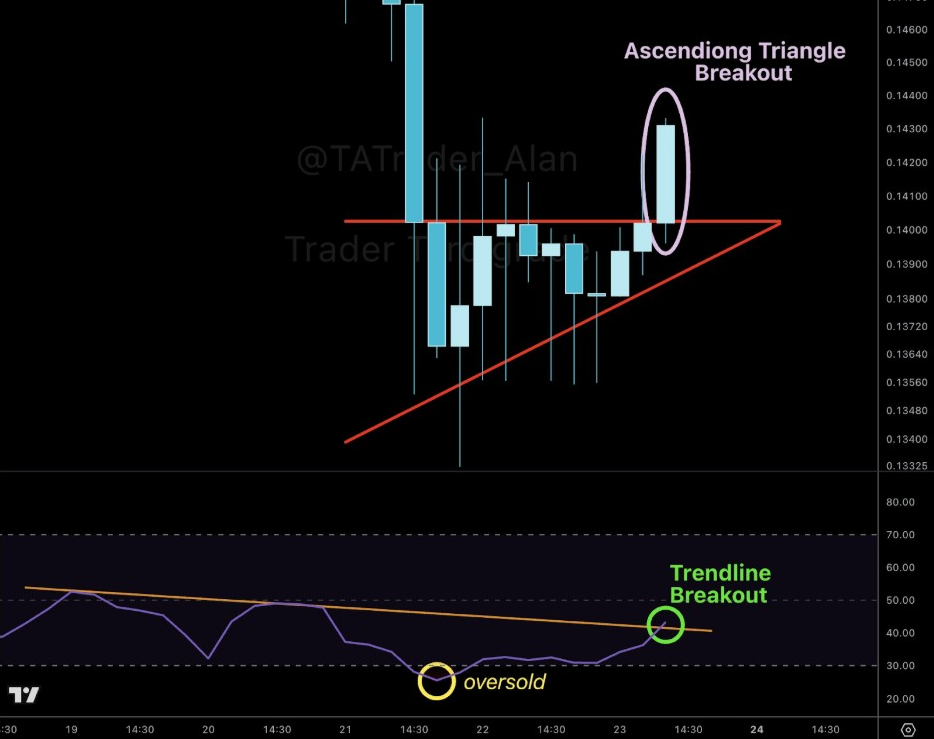
In addition, the H4 RSI even broke the trendline after hitting the oversold zone. This combination of signals is suggestive of increasing momentum. The move could be the beginning of the first stage of a short-term reversal.
However, the Dogecoin price needs to regain some key liquidity pockets before sentiment shifts. A sustained move above the local resistance would add to the bullish case.
Analysts Discuss Long-Term Targets and Market Cycles
Another perspective comes from BitcoinSensus, which claimed Dogecoin reaching $1 is “inevitable.” His chart displayed a long-term arc that extends up to 2026. The pattern exhibits repeated periods of expansion and prolonged periods of consolidation.
Since previous cycles saw rallies, he says the direction of the next big move could be the same.
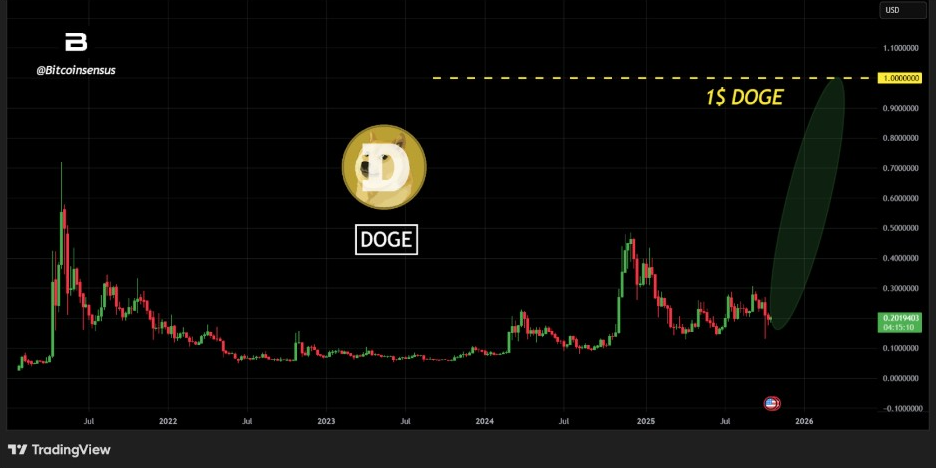
He also questions whether the $1 milestone could be reached before the end of 2025. The long-term chart reveals a number of accumulation pockets that are reminiscent of previous breakout conditions.
However, this view is very dependent on a strong market recovery across major assets. As a result, the traders view the projection as long-term and conditional. Yet it is part of the larger discussion about possible market cycles.