
 Zylo Ecosystem
 Walrus
 Bitcoin
 Sui
Sui Quantus
 Quant
Quant Starknet

The Solana price is approaching a critical support area as analysts warn that the asset must maintain the $120 zone to avoid a larger market decline. The level has previously been tested a couple of times in 2024 and 2025.
According to the chart data, if Solana price cannot maintain the support, it could fall to $70. The chart indicates a sharp decrease since its September high of around $240, as it now moves around $129.
Each time Solana approached this region over the previous months, it bounced back with considerable strength. We previously saw major responsiveness on the same horizontal support in early 2024 and mid-2024. That adds credibility to the significance of the level to the overall trend.
The asset rebounded to this point in May and July, providing a regular trend of rebounds that made the zone more credible. Again in March 2025, the zone provided support to the Solana price, which pushed it above $240.
Historical Market Context Shows Multi-Cycle Defenses at the Same Zone
Short-term Solana price charts also show the $120 support level as a significant zone. The asset has generated at least eight significant rebounds by the same region. All the rebounds came at a time when the market was facing strong selling pressure or an overall market doubt.
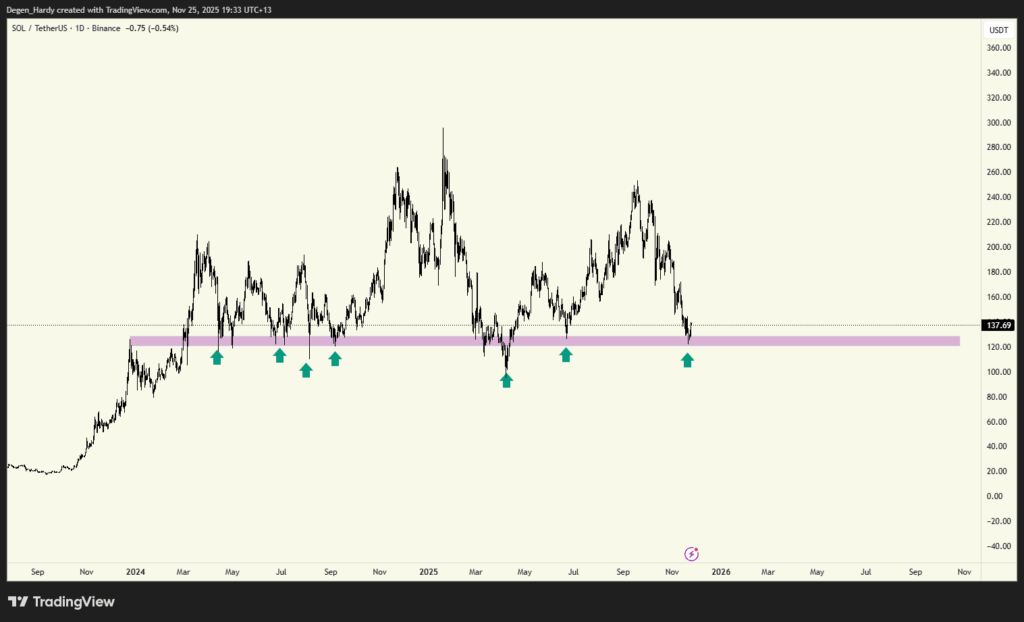
The responses in April, June, July, September, and December 2024, as well as the surge in March 2025, indicate a significant accumulation at the price level in the past. Looking at the current set-up, we see that the present drop into this area is on the same trend as the past few resets of the cycle.
Short-Term Solana Price Structure Points to Rebound Possibility
Looking at the four-hour chart, we observe that the latest Solana price structure has been oscillating within the $136 to $144 range several times over the past few sessions. The chart suggests a potential recovery, but it is contingent upon the bulls regaining the $144 value.
Analysts point out that stabilization in the price above the middle point of the short term would enable room for the Solana price to extend to the $152 area.
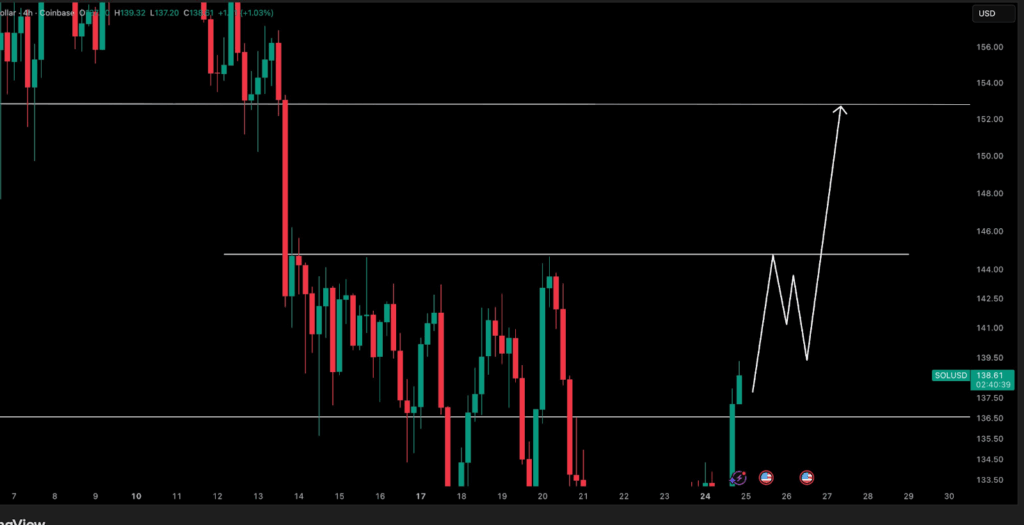
The short-term structure fits automatically with the broader context of the week. Although the support at the higher time frame of $120 is the critical level, the region of $144 is the initial structural point of any meaningful recovery.
The visual line graph presents a possible series of consolidations and breakouts that would enable the market to gain momentum. This would later see the Solana price attempt to retrace its higher highs.
Looking at more data from DeFiLlama, we can see that the Total Value Locked amounted to $8.943 billion at press time. The figure represents a 5% increase over 24 hours. At the same period, chain revenue was $90,141, and total chain revenue on the day was $700,630.
The trend of TVL has been growing steadily over the long term, from the early part of 2023 to its peak in 2024 and 2025. This is despite the Solana price returning to the $120 range on multiple occasions.
This drift in network participation and market price suggests that developer activity, liquidity supply, and user demand may not be directly involved in the recent correction.



