
 streamoors
 Sword Inu
 Altai the Tiger
 IGNITION
 no crying in the casino
 NEAR Protocol
 Pudgy Penguins

Ethereum price is trading close to a major inflection zone as accumulation trends and technical structure coincide. At the same time, the level of resistance remains a limiting factor for the upside momentum on various timeframes. As a result, Ethereum price is now at a very decisive point that might determine the next direction.
Ethereum Price Holds Key Levels As Accumulation Builds
Ethereum price has attracted new attention after some notable on-chain accumulation activity. According to recent blockchain data, more than 23,600 ETH was transferred from a Kraken hot wallet. The transaction had an estimated value of $73 million at current prices.
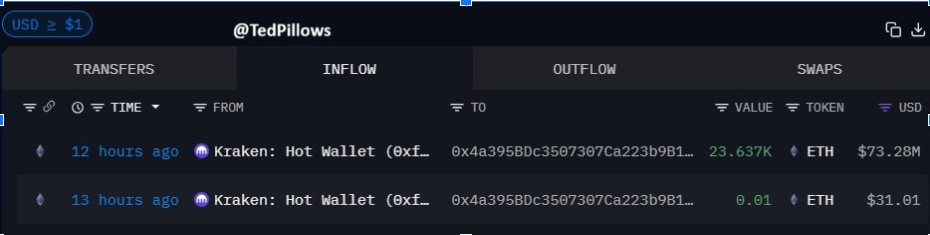
According to market commentary shared by Ted Pillows, the inflow is linked to the activity of BitMine. He added that Tom Lee continues to accumulate ETH during market dips. Importantly, there are no signals for immediate intention to sell related to these purchases.
Generally, sustained accumulation is conducive to price stability during consolidation phases. It also eliminates the liquid supply available on exchanges over time. Therefore, Ethereum price could find downside support despite periods of general hesitation.
However, accumulation alone does not guarantee upside continuation. The price still requires structural confirmation through a break of the resistance level. For now, flows build up support, but direction is unresolved.
ETH Price Trend Structure Indicates Expansion
ETH price continues respecting an ascending trendline visible on the lower timeframes. A model for repeated trendline retests is a volatility expansion model shared by Crypto King. Notably, each retest has shown stronger and stronger upside reactions.
The first retest gave a 14% expansion. The second was followed by a larger move, reaching nearly 18%. Presently, a third retest is building up near the same structural assistance.
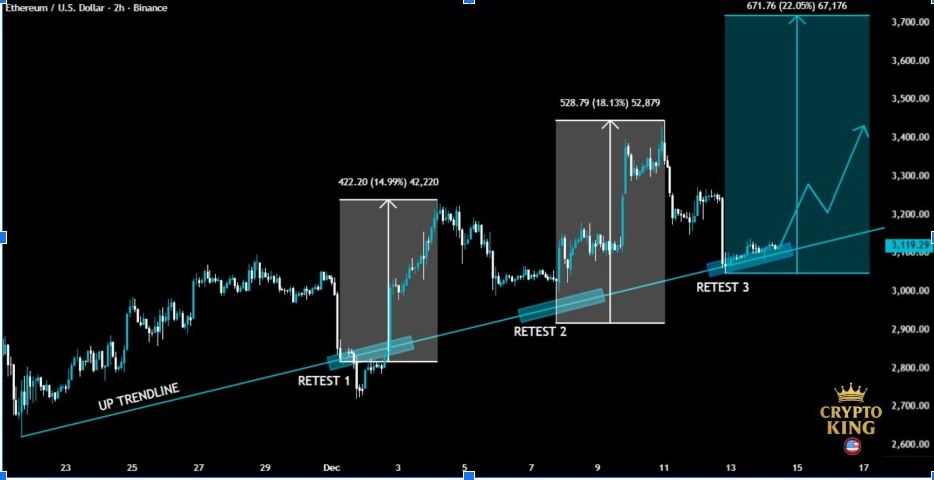
Based on this pattern, the model is projecting a potential 22% upside move. This projection is in line with a price target near the $3,700 region. Meanwhile, buyers continue to bid on the trendline, indicating active demand.
In addition, there have always been higher lows along the trend. This behavior is of a compounding structure rather than a distribution. Still, a strong breakdown below the trendline would invalidate the setup.
For now, the top altcoin is holding constructive technical conditions. Momentum is dependent on sustained closes above nearby resistance. Until confirmation is received, expansion is conditional.
Ethereum Price Compressed Below Key Resistance
Ethereum price has been moving sideways for several sessions inside a clearly defined range. Ted Pillows noted that the price is still capped below the $3,400 resistance zone. Failure to reclaim that level results in a $3,000 retest being more likely to occur as a result.
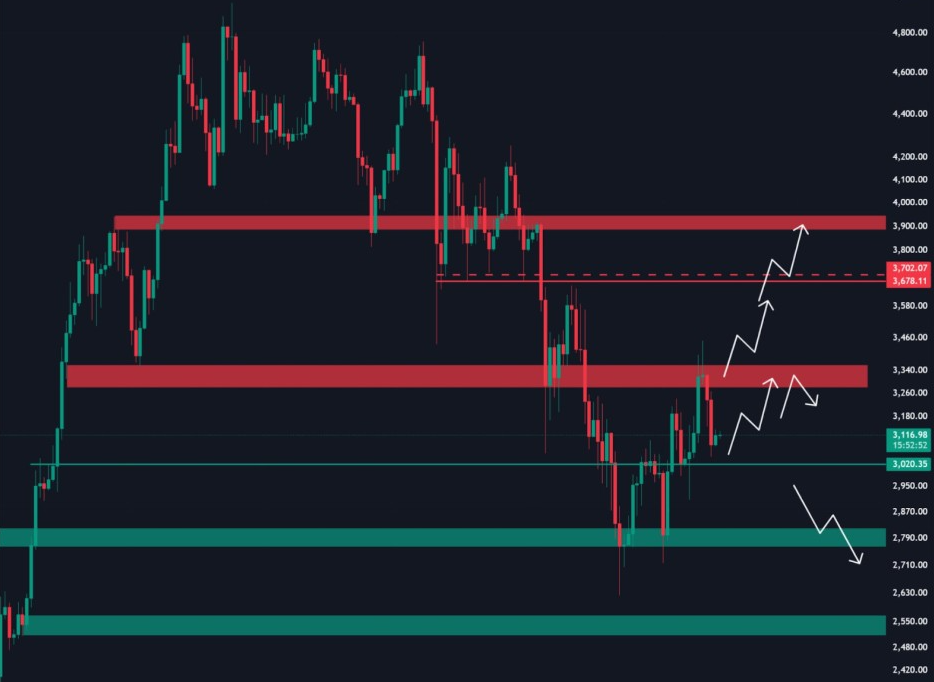
Higher timeframe charts display repeated rejections around upper resistance bands. These zones run in a cluster between $3,800 and $3,900. Below the current price, there is layered demand around $3,200 and deeper around $2,800.
Furthermore, on the daily chart, a sharp breakdown occurred on the previous day, followed by a partial recovery. Ethereum price has regained mid-range support around $3,100. However, it is still trading below the broader value area high.
At press time, ETH price traded around $3,090 with intraday volatility. Volume is constant, but without expansion characteristics. As a result, compression is more likely than an immediate breakout.
Long-Term Levels Signal Cautious Expectations
However, Ethereum price projections vary when analyzing with higher timeframes. Ali Martinez posted a weekly chart showing significant support and resistance zones in history. He assesses that new all-time highs may not be reached until February.
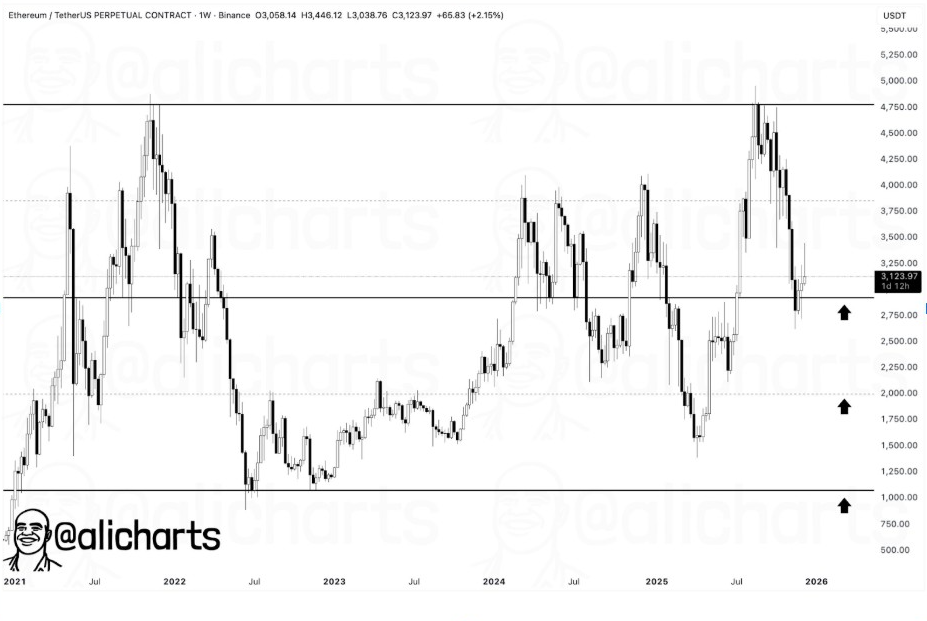
The chart showed strong resistance in the $4,800 to $5,000 area. Current price action continues well below that ceiling. Meanwhile, intermediate resistance near $3,700 is a key hurdle.
At the same time, the chart indicates long-term support at around $2,750 and $2,000.
These zones used to produce strong upside reactions. Accordingly, they may act as fallback levels if the momentum is weakened.
This outlook is in contrast to short-term models of expansion. It focuses on patience and not on aggressive upside assumptions. The view is consistent with general liquidity conditions and macro uncertainty.



