Bitcoin
 Aerodrome Finance
 Zerebro
 Starknet
 Zama
Zama Pearl
Pearl ZKsync

Bitcoin price entered late December under pressure after posting its weakest fourth quarter performance since 2018. Data cited by Coin Bureau showed Bitcoin recorded a 22.54% monthly decline so far this quarter.
The last comparable fourth-quarter downturn occurred in 2018. At that time, the Bitcoin price fell more than 42% during the same period.
The weakness mattered because Bitcoin still traded near 88,000 dollars despite worsening performance metrics. That divergence suggested hidden stress beneath stable price action.
Analysts tracking liquidity, miner behavior, and exchange flows flagged mounting risks alongside emerging contrarian signals.
Liquidity Quietly Dried Up While Bitcoin Price Stalled
Liquidity conditions shifted sharply over the past month, according to exchange flow data shared by CryptosRus. On Nov. 24, Bitcoin traded at 88,438 dollars while Coinbase recorded seven-day inflows of 21.026 billion dollars. Binance added roughly 15.279 billion dollars during the same period.
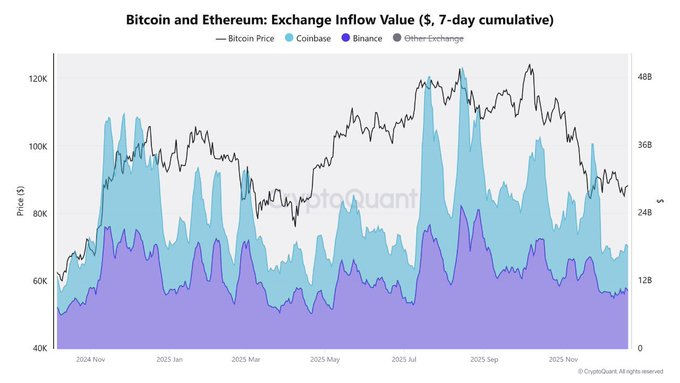
By Dec. 21, Bitcoin price edged slightly higher to 88,635 dollars, yet inflows collapsed. Coinbase inflows fell nearly 63% to 7.763 billion dollars, while Binance inflows declined to 10.259 billion dollars.
The contraction occurred without meaningful price movement, highlighting a slowdown in trading urgency. CryptosRus noted that assets no longer rushed toward exchanges, signaling fading sell pressure.
When prices hold steady while liquidity tightens, supply often absorbs quietly rather than distributes. Thin liquidity historically preceded sharp directional moves once traders regained confidence.
Buying Pressure Weakened Across Market and On-Chain Data
Market structure signals echoed the liquidity slowdown. A separate analyst noted declining buy-volume divergence on Binance futures since August. While Bitcoin price continued rising, volume consistently declined, mirroring behavior seen before the 2021 cycle peak.
On-chain participation weakened simultaneously. The number of active addresses slowed sharply, a metric often linked to over-the-counter activity and broader network engagement.
The analyst warned that the expected reversal never materialized. This suggested that the price followed a late-cycle distribution path instead.
From that perspective, recent upside attempts resembled the final phase of the 2021 advance. The analyst said markets required time to recover regardless of whether the traditional four-year cycle remained intact. The current phase reflected exhaustion rather than expansion.
Miner Capitulation Added a Contrarian Signal
Despite weakening demand signals, miner behavior introduced a potential counterweight. CryptosRus cited VanEck data showing Bitcoin’s hashrate dropped roughly 4% by mid-December.
The decline aligned with classic miner capitulation patterns observed near previous market bottoms.

VanEck said falling hashrate indicated weaker miners shutting down operations. The process historically cleaned the network, leaving stronger participants in control. Similar washout phases previously preceded strong 90-day and 180-day Bitcoin price recoveries.
Miner stress often appeared before accumulation phases, according to VanEck. While not predictive of timing, the signal suggested downside pressure might already reflect forced selling rather than organic distribution.
Key Technical Levels Defined the Near-Term Battlefield
Short-term price structure remained tightly compressed. KillaXBT said Bitcoin needed to hold the 86,000 to 87,000 dollar range to reclaim momentum. A sustained defense of that zone increased the probability of a move back above 90,000 dollars.
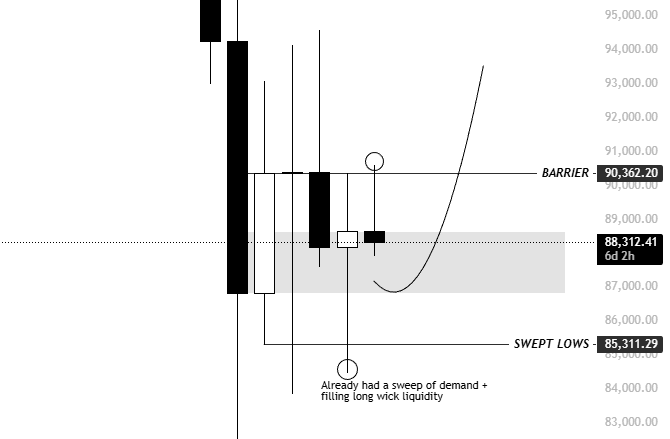
He added that larger players appeared comfortable encouraging short positions above 90,000 dollars. That behavior suggested liquidity conditioning rather than trend continuation. According to KillaXBT, market makers often build liquidity before reversing direction.
Failure to defend the 86,000 dollar area risked accelerating downside pressure in thin liquidity conditions. With exchange inflows muted, even moderate selling could amplify volatility.
Long-Term Cycle History Tempered Short-Term Optimism
Veteran trader Peter Brandt placed the current drawdown within Bitcoin’s broader historical context. Brandt said Bitcoin experienced five parabolic advances over fifteen years, each followed by declines exceeding 80% on a logarithmic scale.
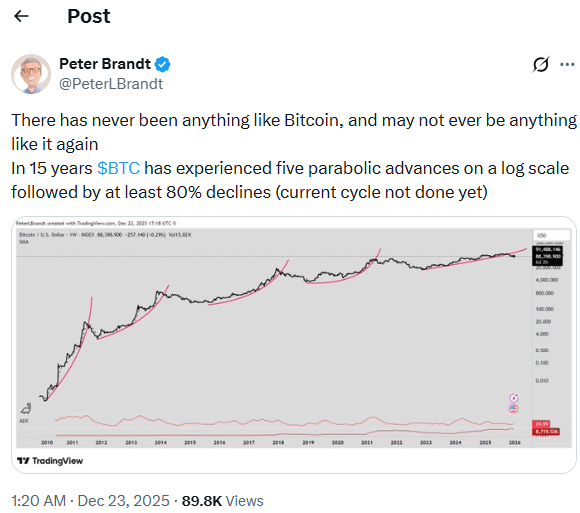
He warned that the current cycle remained unfinished. While Bitcoin differed structurally from prior cycles, Brandt emphasized that extreme volatility defined its long-term behavior. His perspective underscored why sharp corrections remained structurally normal rather than anomalous.
The statement reinforced caution around assuming price stability equaled strength. Historical precedent showed Bitcoin often consolidated deceptively before decisive moves.
What Comes Next for Bitcoin Price
Bitcoin BTC price hovered near a critical inflection zone heading into year-end. Liquidity contraction, weakening on-chain participation, and declining buy volume painted a fragile short-term picture. However, miner capitulation and reduced selling pressure offered early contrarian signals.
The immediate focus remained the 86,000 to 87,000 dollar support range. Holding that zone kept 90,000 dollars within reach, while failure risked deeper retracements in thin markets. Direction likely depended on liquidity returning rather than sentiment shifting alone.
For now, Bitcoin price reflected balance rather than conviction. The next move may arrive once traders stop expecting it.