astronaut
 Pearl
Pearl Zcash
Zcash Walrus
 NEAR Protocol
 Starknet
 Pudgy Penguins

Bitcoin price is stuck below the important level at $90,000, with any rebound facing substantial resistance. The coin was trading at $87,430 on Saturday, much lower than the year-to-date high of $126,250. This article examines why the BTC price is more vulnerable to downside based on a multi-timeframe analysis.
Bitcoin Price Has Formed Bearish Patterns on the Weekly Chart
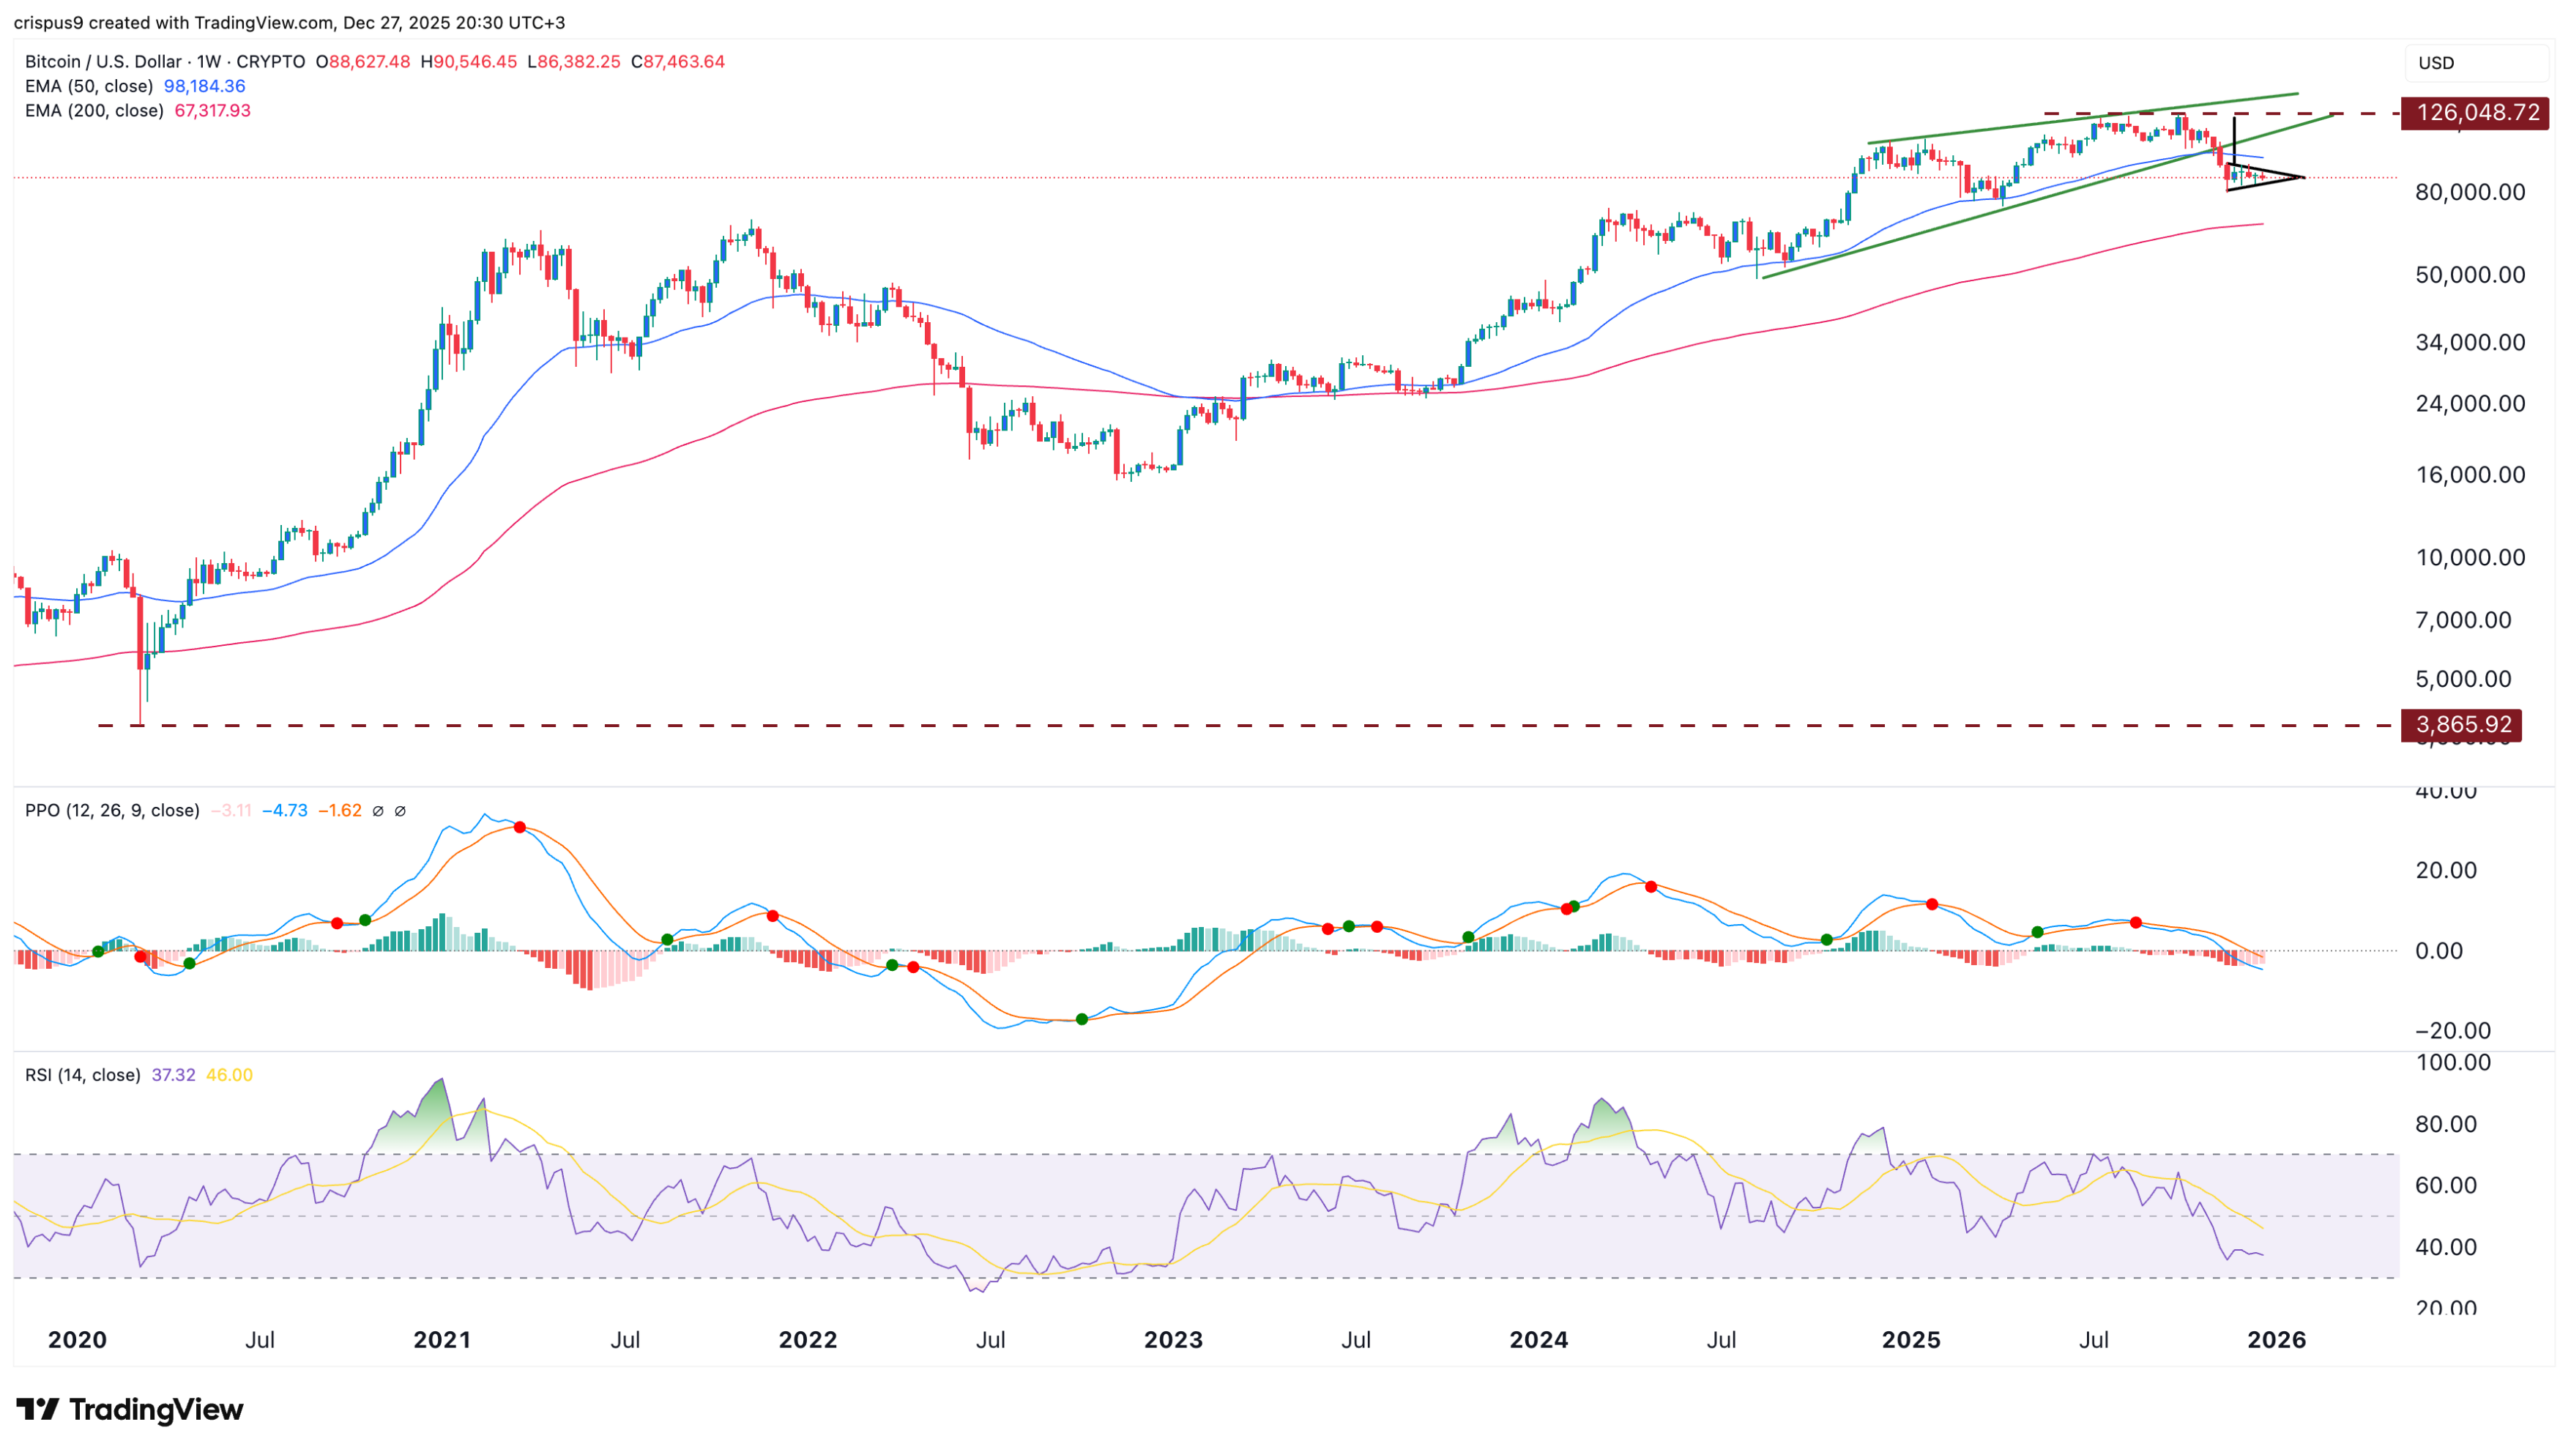
The weekly timeframe chart shows that Bitcoin price has been in a bull run in the last few years. It jumped from below $4,000 during the covid pandemic to a record high of $126,250.
A closer look reveals that this coin has been forming numerous bearish patterns, indicating further downside in the coming weeks.
The most visible pattern is a rising wedge, which started forming last year. This pattern is made up of two rising and converging trendlines and is one of the most common bearish reversal patterns.
The coin is now forming a bearish pennant pattern. It has already formed the vertical line and is now in the symmetrical triangle section. The two lines of this triangle are nearing their confluence, meaning that it may have a bearish breakout in the near term.
Bitcoin has already moved below the 50-week Exponential Moving Average (EMA). Additionally, the Relative Strength Index (RSI) and the Percentage Price Oscillator (PPO) have formed a bearish divergence pattern. This pattern forms when these indicators form a series of lower lows when an asset is in an uptrend.
Therefore, the combination of a rising wedge, bearish divergence, and the fact that it has moved below the 50-week moving average indicates that it will likely continue to fall. If this happens, the next level to watch will be the April low of $74,500, followed by the 200-week moving average at $67,317.
BTC Price Daily Chart Analysis
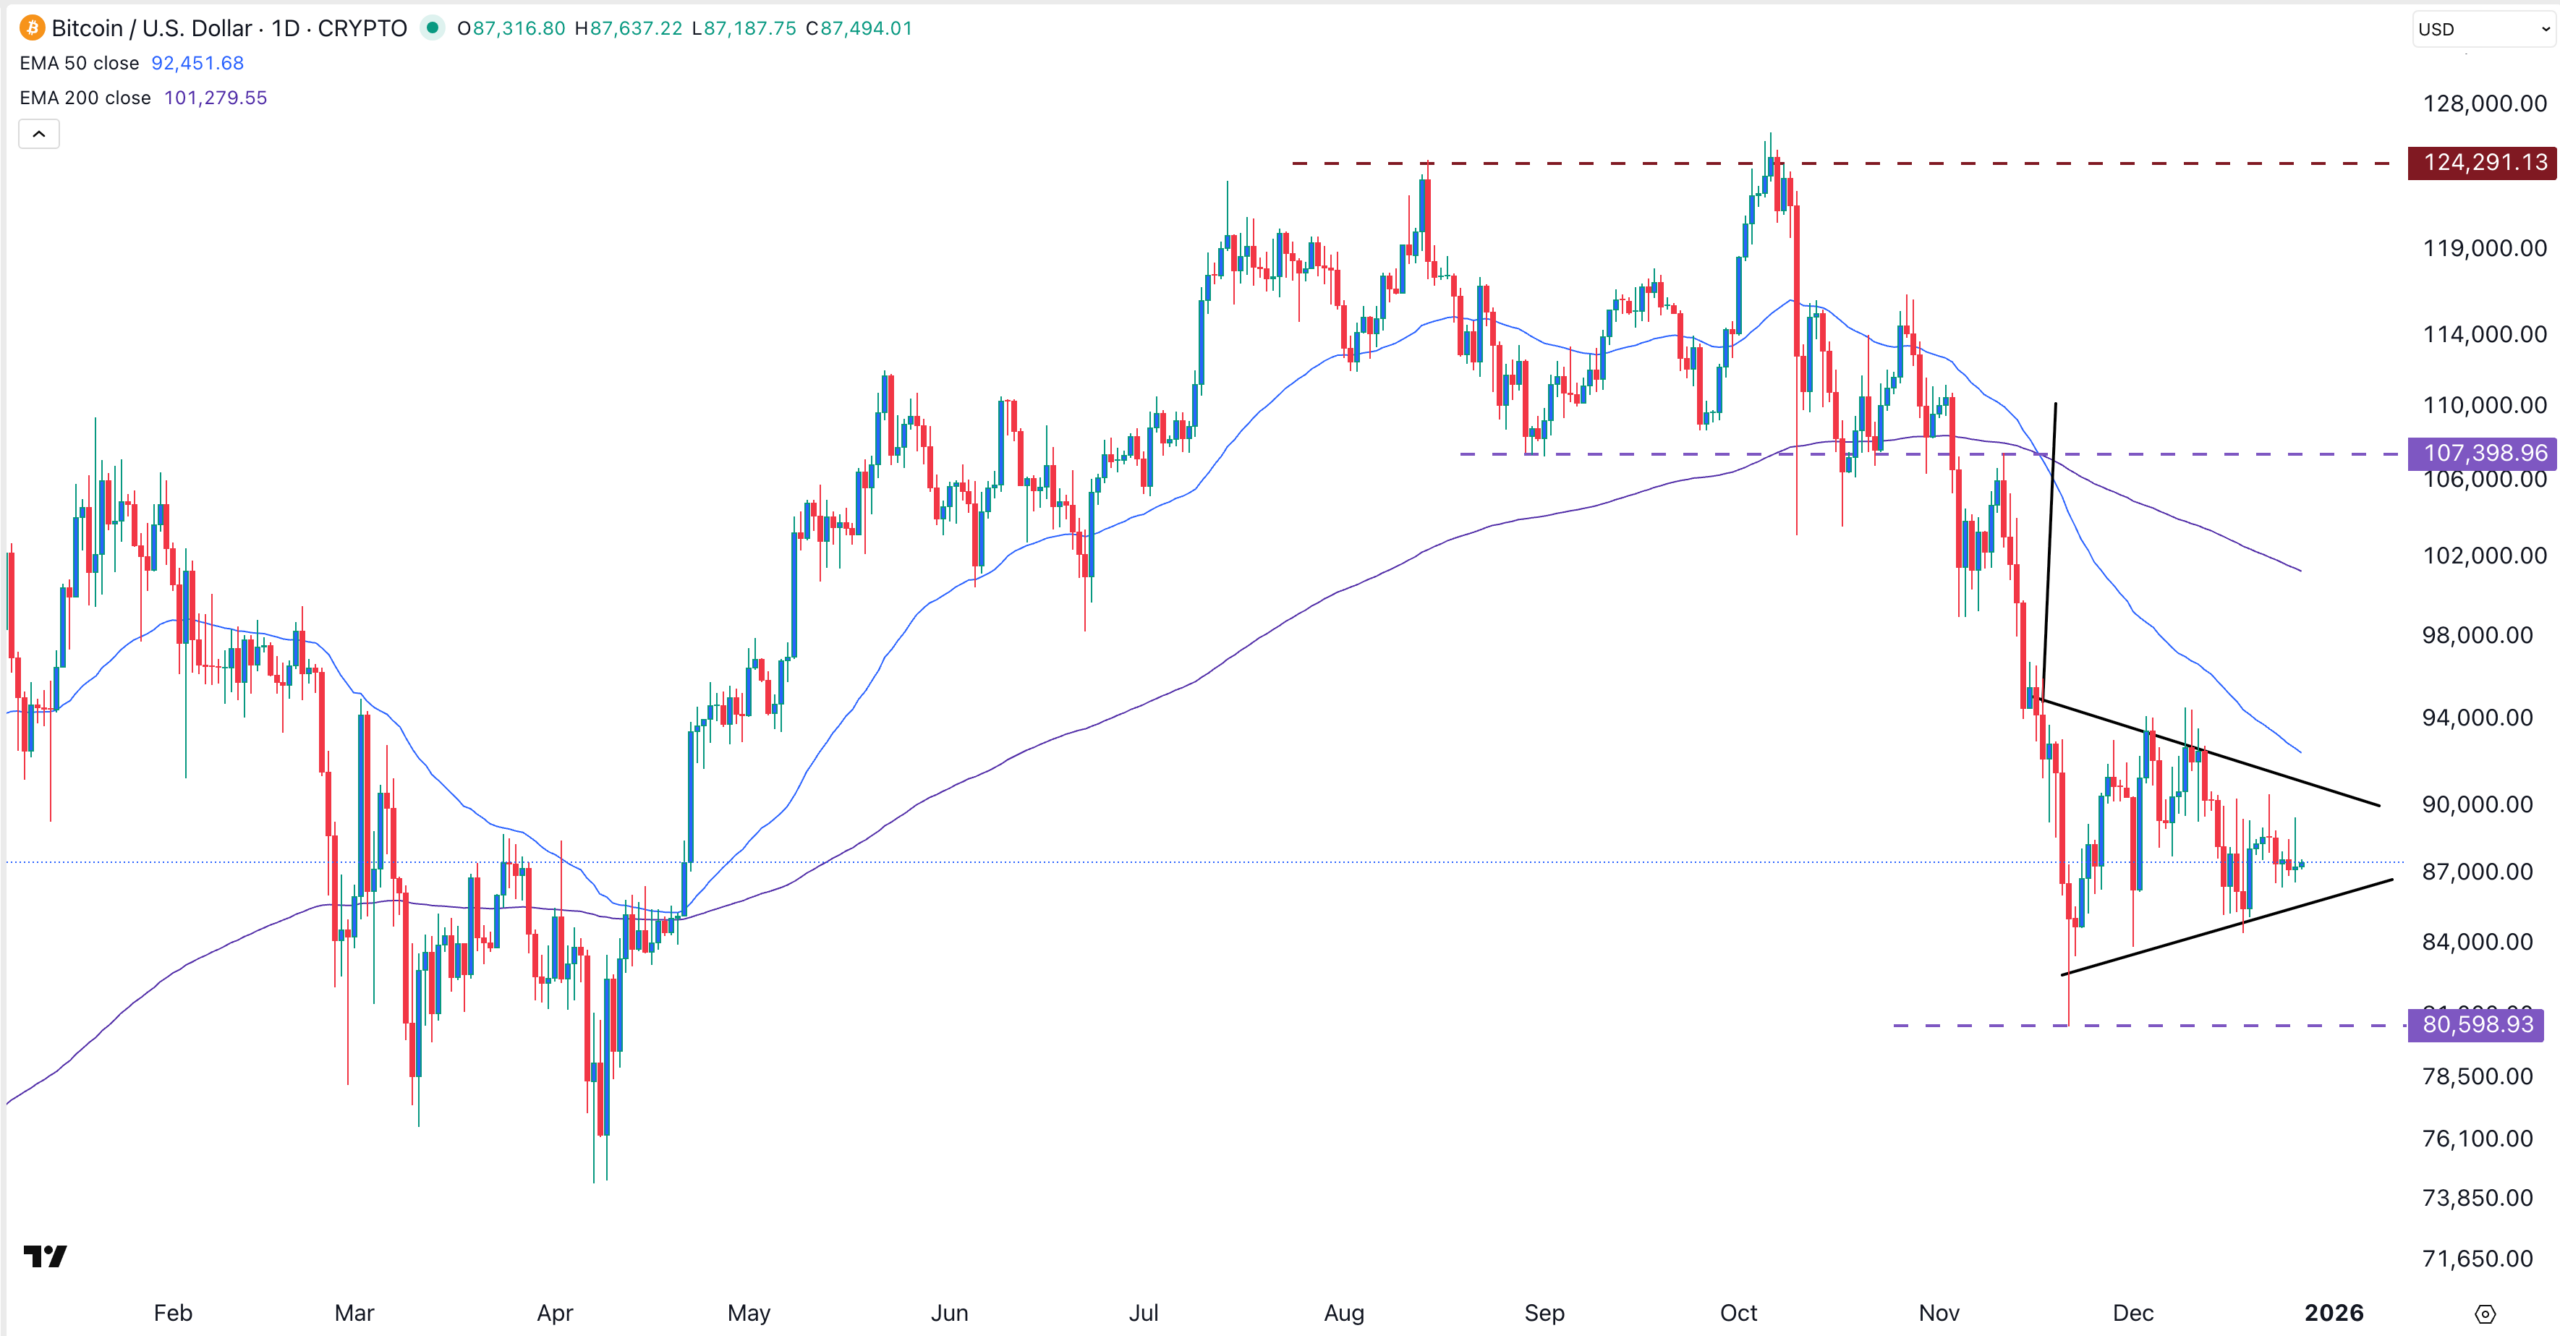
The daily chart also points to a bearish Bitcoin price prediction. It formed a double-top pattern at $124,290 and a neckline at $107,98. A double top is a highly bearish chart pattern, as it indicates that bulls are hesitant to place bids above that level.
Bitcoin formed a death cross pattern on November 16 as the 50-day and 200-day Exponential Moving Averages (EMA) crossed each other while pointing downwards. This pattern means that the short-term bearish momentum has prevailed.
As with the weekly chart, the coin has formed a bearish pennant pattern. It has also remained below the Supertrend indicator, meaning that bears have prevailed.
Therefore, in this case, a bearish breakout will result in a drop to the key support level at $80,600, its lowest level since November. A drop below that price will lead to more downside.
Spot Bitcoin ETF Outflows and Market Manipulation Concerns
A likely reason why the BTC price may experience a bearish breakout soon is that demand for its ETFs has declined over the past few days.
Data compiled by SoSoValue shows that the spot Bitcoin ETFs experienced $506 million in outflows last week, following a $497 million outflow the week prior. These funds have lost $804 million this month, an improvement from the $3.48 billion in November last.
They now have over $56 billion in cumulative inflows, down from the all-time high of over $64 billion. ETF outflows result in increased Bitcoin supply, which in turn affects its price. One potential reason is that investor are moving to other ETFs like gold and silver that are doing much better.
At the same time, concerns have arisen that the largest players in the crypto industry are manipulating its price. One major concern is that they are dumping Bitcoin whenever it attempts to rebound.
A good example of this happened on Friday when Bitcoin price dropped suddenly. On-chain data shows that companies like BlackRock, Wintermute, Binance, and Kraken dumped Bitcoins worth over $2.5 billion at almost the same time.