Covenant x402
 Pearl
 Sui
 Bitcoin
 Quack AI
 NEAR Protocol
 Quant

- EOS has a current market/Max TPS of 272/3996(variable) and EOS infostones is the producer.
- The token has shown the pattern of three outside up on 1 August.
- The RSI oscillator for EOS shows the SELL action.
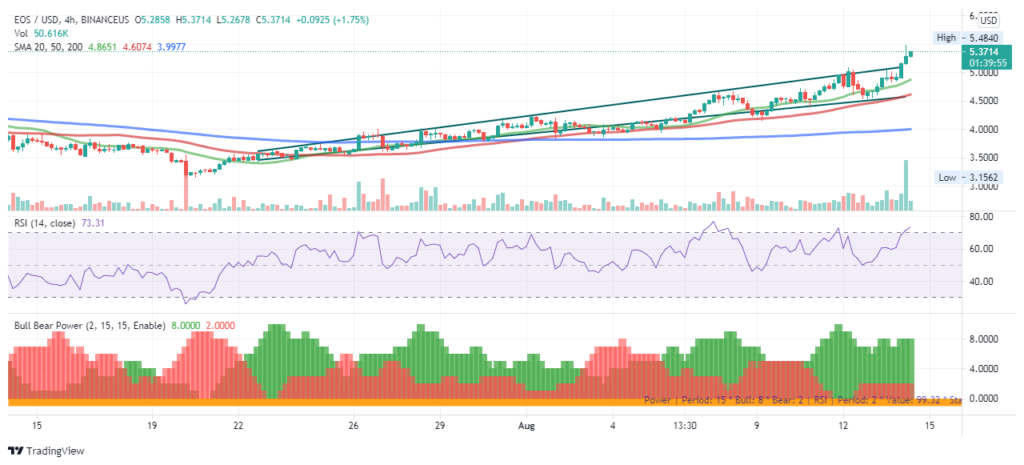
The last known price of the token, EOS, is $5.37 and is up by 12.98 over the last 24 hours. It has the current trading volume(s) of 2,249,468,512 with a gain of 11.85% over the last 24 hours. EOS has total addresses of 14,005 with the active address(es) of 414.344 in the last 24 hours. It has a circulating supply of 956,038,425 EOS coins and the max. supply is not available

The chart above shows the movement of EOS where 200 DMA has been running below it and even DMA-50 is below it. We see the token with respect to SMA’s which are 20, 50 and 200 and it is SMA-20 which is ahead of both the SMA’s, one (SMA-200) SMA and also above the other (SMA-50). We see an upward pattern here. The trend line marked shows this upwards shifting. All the three SMA’s are parallel to each other and we expect that the token might show a hike in price now.
Its top 10 and 20 holders have more than 65% holdings and top 50 and 100 have more than 80% which makes the strong supply side of the coin.
An RSI oscillator is also present in the chart which shows the proper time to buy or sell the token. RSI for the last 5 hours shows the value of 72.623 and marks the buy action. MA-5, MA-10 and MA-20 show the buy action. Even MA-100 and MA-200 show the same buy action. However, the EOS at present is all set to sell.
The bull/bear power has the value of 0.2739 and shows the buy action. The high/low marks the bujy action with the value of 0.0029.
The EOS-BTC pair is trailing at the level of 0.000123 and the gain of 6.52% was seen whereas the EOS-ETH pair is trailing at the level of 0.00162 and the gain of 4.34% was seen in the last 24 hours. The volume/market cap of the token is 0.4363 and its market dominance is 0.26%.
Conclusion: The coin had moved on a steep path and is likely to move up likewise in the coming time also. However it would be better to sell the token now rather than waiting to reach the coin up ahead.
The days range for the coin is 4.7952-5.4791 and presently is at 5.3610. The 24 hours high and low of the coin is 5.46 and 4.73 respectively.
Technical Instruments:
Pivot: 5.3113
R-1: 5.3343
R-2: 5.3484
S-1: 5.2883
S-2: 5.2742
Note:
- The unit is USD
- SMA-20: Green colour
- SMA-50: Red colour
- SMA-200: Blue colour