
 astronaut
 Pearl
Pearl Hyperliquid
 Walrus
 Pudgy Penguins
 Bitcoin
 NEAR Protocol

Ripple XRP price is currently trading at approximately $1.35 after recurrent rejections beneath a falling trend line. Most recently, price action has compressed around a critical support level at $1.30. Analysts note diverging indicators in both the short-term structure and the long-term cycle models. The XRP price prediction remains in the range, and market capitalization trends suggest it could expand to the $3 zone.
XRP Price Tests Macro Support
Analyst CRYPTOWZRD’s daily chart shows XRP price respecting a descending trendline from the $3.50 zone. Each rally attempt has failed below prior lower highs. The most recent rejection was around the $2.30 resistance. This move validates the continued dominance of sellers in the broader corrective system.
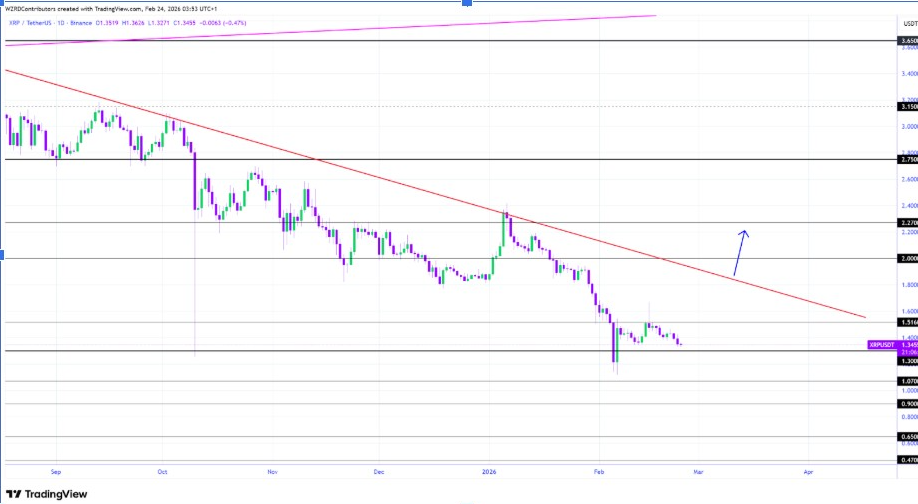
Currently, XRP price action hovers just above horizontal support at $1.30. This level aligns with prior demand and a recent liquidity sweep toward $1.25. The rebound that followed lacked strong continuation momentum. According to the analysis, buyers are reactive rather than initiating structural reversal conditions.
The first stabilization signal would require reclaiming the $1.51 level on a sustained basis. A move above $1.60 could allow a retest of dynamic resistance near $2.00. Above that, the $2.30 level remains the decisive barrier. Failure to hold $1.30 would expose downside levels near $1.00.
Macro Model Flags Deep XRP Price Cycle Support
Additionally, analyst ChartNerd’s macro framework focuses on a three-month Gaussian Channel structure. The upper regression band is currently close to the $0.73 level. In the past, XRP price retests of this curved support highlighted macro cycle bottoms. Other similar retests preceded major expansions in 2017, 2020, and 2024.
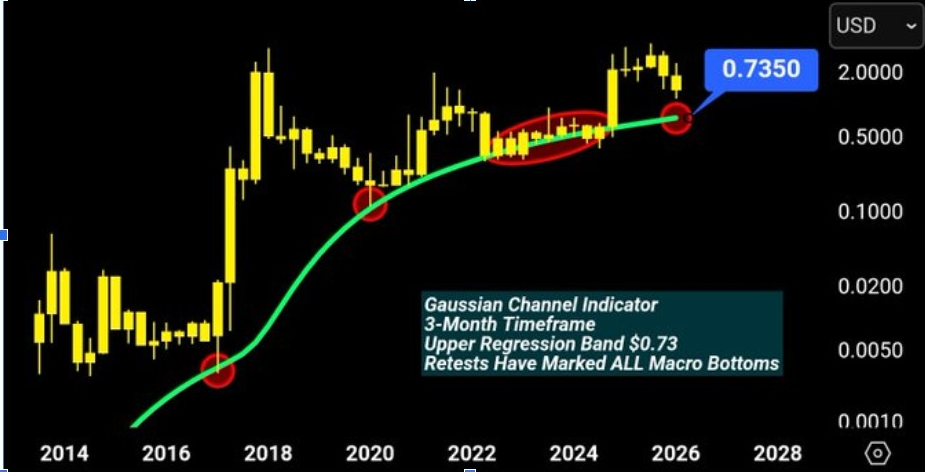
Moreover, the current XRP price is above this macro support zone. Nonetheless, this support is recognized as a common structural level of invalidity in the model. A drop lower than $1.00 may increase pressure to the downside towards this zone. Long-term investors tend to historically accumulate near this regression curve.
As long as the price remains above the Gaussian support structure, the broader cycle will be preserved. Macro stability would increase with higher support. In the meantime, a revisit of the $0.73 zone will be historically consistent with long-term reset conditions. This framework positions deep support as structural rather than immediate.
XRP Price Prediction Signals Expansion Toward $3
According to analyst Hailey LUNC, the analysis focuses on XRP market capitalization dynamics. The structure shows a multi-year ascending trendline from 2017. Price movements form a compressing triangle pattern across macro cycles. Such volatility precedes directional expansion phases in crypto markets.
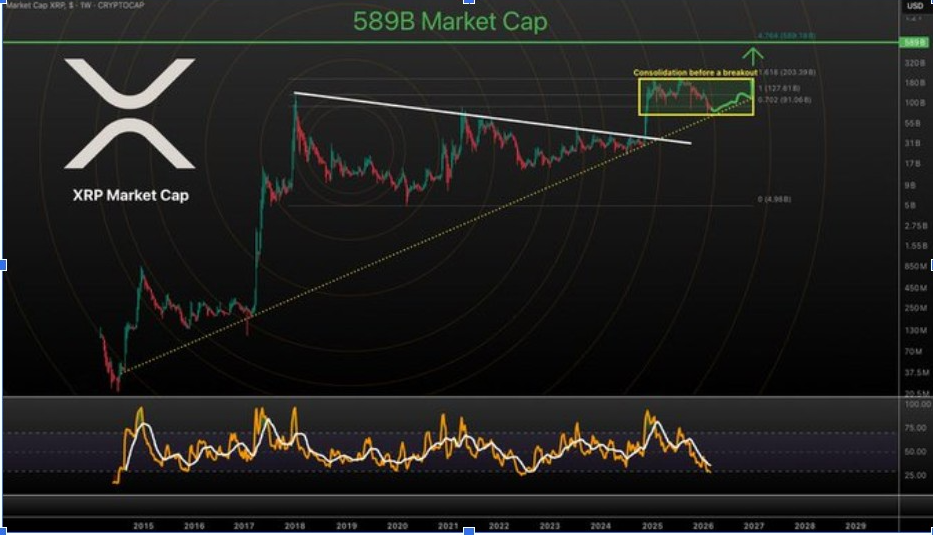
Furthermore, the upper boundary of the triangle capped previous advances near the $330 billion range. Meanwhile, ascending support continues to increase macro lows gradually. This tightening range suggests structural consolidation rather than a distribution shift. XRP’s price is coiling near resistance rather than showing strong rejection.
In addition, a Fibonacci projection within the model highlights upside potential toward a $1.6T market capitalization. The latter growth might align with XRP price prediction of $3.00. Momentum indicators show consolidation without extreme oversold values. Historically, stabilization around mid-range RSI was followed by phases of expansion.
Meanwhile, Ripple price is in compression between both resistance and macro support. In the short-term structure, the defensive levels are highlighted around $1.30 and $1.51. Further, deep support is determined by long-term models around $0.73. The asset remains between reactive demand and structural resistance.



