
 streamoors
 IGNITION
 no crying in the casino
 Sword Inu
 Altai the Tiger
 NEAR Protocol
 Quantus

XRP price is nearing a significant technical level with a long-term setup and short-term resistance converging. Recent charts indicate the formation of a wider bullish structure, but the short-term price action is pushing against a sell wall, which might determine the direction that will follow. If that resistance breaks, one analyst places the next clear upside zone near $1.95. In that setting, the current XRP price is being shaped by both macro reversal signals and near-term breakout pressure.
XRP Price Nears Completion of Triple Bottom Setup
According to EGRAG CRYPTO, the XRP price is forming a long-term triple bottom structure on the macro chart. This pattern is often tracked as a reversal formation because it shows repeated support defense over time. In this case, price has declined into a similar region three times and rebounded on each occasion. That repeated reaction suggests sellers have struggled to force a deeper breakdown.
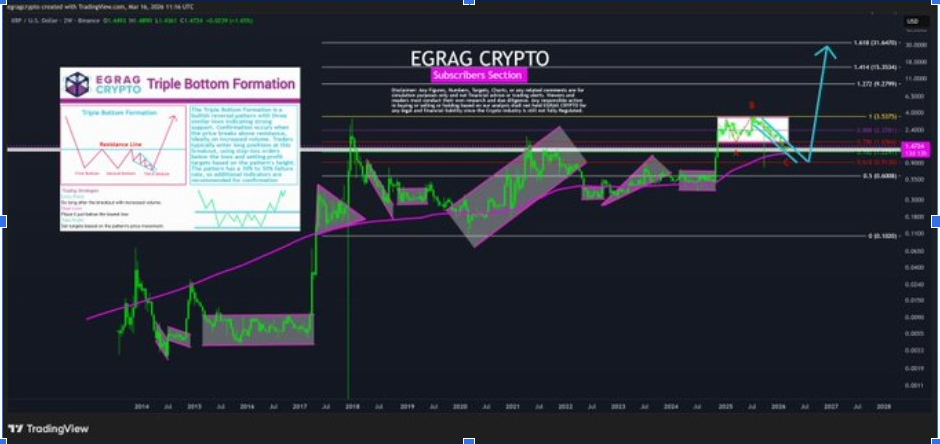
The chart also shows XRP price moving through accumulation zones after each bottom. In earlier cycles, similar consolidation phases were followed by stronger upward expansions. EGRAG’s view is that the third bottom is now close to completion, which may place Ripple price near the final stage of a long basing process. As price tightens beneath resistance, the structure begins to look more constructed.
Moreover, the projected path on the chart suggests the next major move could begin once resistance levels above the current range are cleared. Triple bottom formations usually require confirmation through a break above nearby ceilings. If that happens, the XRP price may shift from accumulation into expansion. That is why the resistance bands above the market remain central to the current setup.
Bullish Cycle Signal Marks First Shift Since July
CW’s chart presents XRP inside a multi-phase market structure that tracks earlier cycles of compression and expansion. The analyst notes that the latest setup resembles prior periods that eventually led to strong rallies. That comparison is important because it suggests the current XRP price may be entering a new phase rather than extending a stagnant range. In this view, the recent structure marks the first stronger rally signal since July 2024.
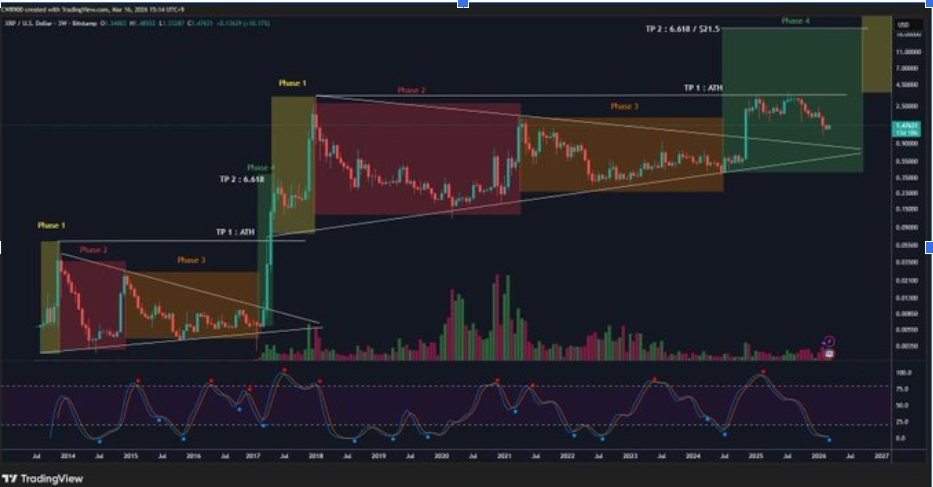
According to the chart, XRP has historically moved through repeating phases where accumulation gives way to upward acceleration. The current market formation matches the previous transitions. That does not imply a repeat, but it gives the current rally attempt a more technical background. It also enables the possibility of Ripple price beginning a new cycle instead of simply recording a short-term rebound.
Furthermore, the chart shows target zones higher than the current levels, including a potential rebound to major highs of the past. These targets are conditional, but they indicate the manner in which the market may develop in case the bullish cycle remains intact. Rising participation and stronger price behavior would be needed for that path to remain valid. In that sense, the XRP price now sits at an early confirmation stage.
Sell Wall Break Could Open Path Toward $1.95
Hailey LUNC XRP focuses on the immediate technical barrier in front of the market. The chart marks a sell wall zone where XRP has previously faced concentrated selling pressure. Price has now rallied back into that band, placing the market directly under a key ceiling. This makes the next reaction especially important for the short-term XRP price outlook.
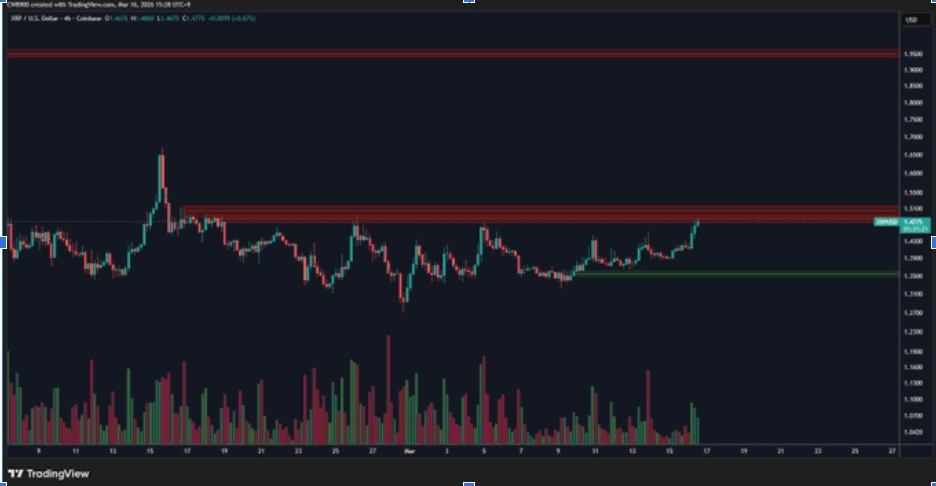
According to the chart, a break above the sell wall could leave little resistance until around $1.95. That means the next section above the current price may be relatively open if sell orders are absorbed. This type of setup often attracts attention because the price can move more freely once a heavy liquidity cluster is cleared. In that context, XRP price is testing the final barrier before the next projected target.
Additionally, XRP price has been printing higher lows while approaching the upper boundary, showing steady buying pressure from below. That kind of compression usually reflects a market preparing for a breakout attempt. If the resistance holds, XRP price could rotate back toward the support zone before trying again.



