Doge Pepe
 Zylo Ecosystem
 Crawlerpad
 Pearl
Pearl Quantus
 Starknet
 Quant
Quant

SUI price returned to the $1 region after a steep weekly pullback erased much of the token’s recent momentum.
Despite the decline, analysts said the current range remains important because Sui continues holding near a long-term weekly support trendline while decentralized exchange activity keeps growing.
A broader recovery now depends on whether buyers can defend the $1 support area and reclaim higher resistance levels.
SUI Price Pullback Reshapes Market Sentiment
After the latest pullback, Sui Community noted that market sentiment has changed sharply. Many traders who were bullish above $5 have turned quiet near $1, even though the chart is now sitting closer to a major reassessment zone.
The weekly chart showed Sui crypto trading near $1.00 on Binance, with the price still below several major reclaim levels. The analyst identified $2.01 as the first important target if buyers regain control. Above that, the chart places the next larger targets near $4.43 and $5.35.
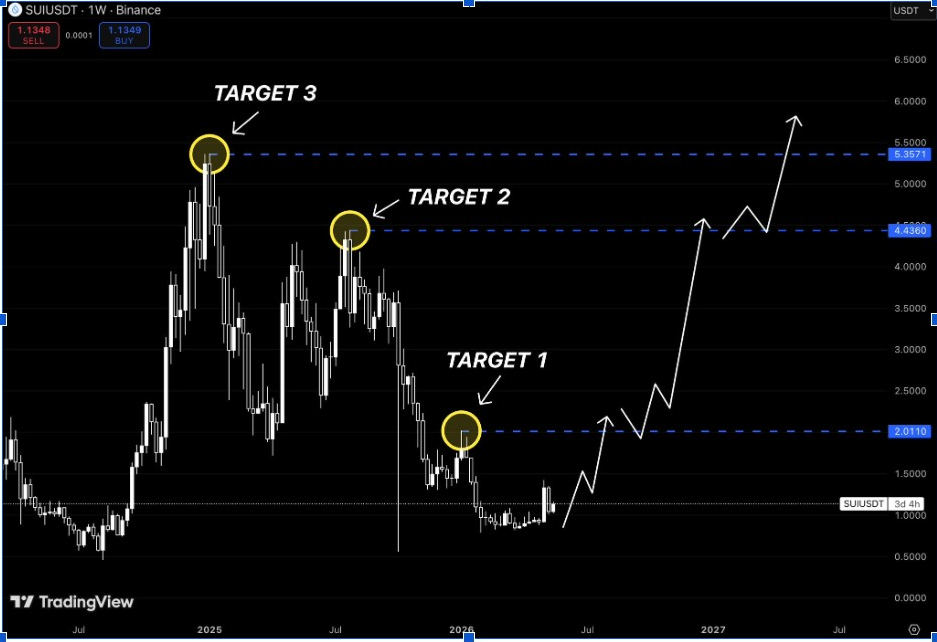
That structure suggests SUI crypto is still early in any recovery attempt. A move toward $2.01 would confirm the first major shift, while a later reclaim of $4.43 would put the previous cycle highs back in focus.
However, Sui price must first stabilize above the $1 area. If SUI crypto price loses this zone, the bullish target map weakens, and traders may wait for deeper support before re-entering.
SUI Crypto Weekly Trendline Remains Important
From a longer-term view, Bitcoinsensus said SUI price is still holding a rising weekly support line that has produced multiple rebounds in the past. The weekly chart showed Sui crypto reacting near the same trendline zone that supported earlier recovery phases.
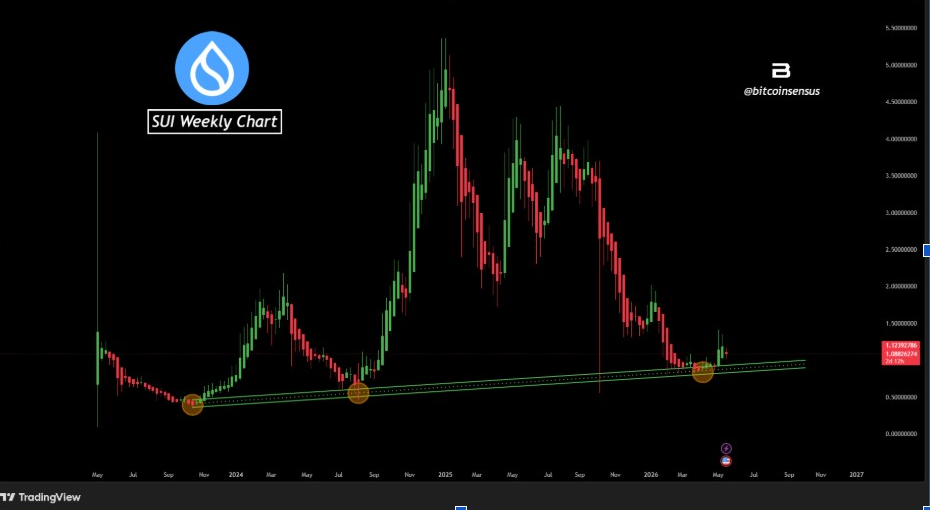
This trendline has acted as a base several times since 2023. Each major touch previously came before a strong upward move, making the current retest important. If buyers defend it again, SUI could form another higher-timeframe rebound.
The latest candles show the price trying to stabilize near the line after a steep decline from higher levels. That does not confirm a reversal yet, but it shows why analysts are watching this zone closely.
A weekly close below the rising trendline would change the setup. In that case, SUI could lose one of its stronger long-term technical supports, which may delay any recovery toward $2 and above.
DEX Volume Strengthens Network Case
Meanwhile, ToreroRomero highlighted that Sui has reached $200 billion in total DEX volume. The shared DeFiLlama chart showed Sui leading several major networks in cumulative DEX growth, ahead of Tron at $146 billion and Optimism at $112 billion.
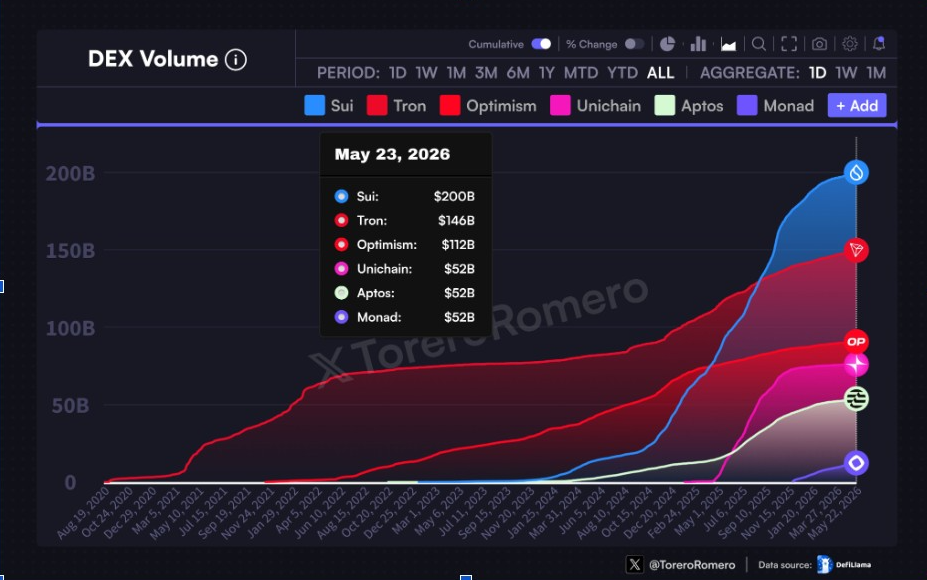
This is a useful signal for the Sui ecosystem. Higher DEX volume shows that users are still trading on the network, even as SUI price struggles. It also suggests that DeFi activity on Sui is not only tied to short-term market excitement.
The chart shows Sui’s DEX volume rising sharply from 2025 into 2026. That puts the network among the more active chains by trading activity and gives bulls a stronger fundamental case.
Still, strong network volume does not mean the price will recover immediately. SUI needs sustained demand, stronger liquidity, and better market conditions before ecosystem growth can translate into a durable price trend.
SUI Crypto Pump Zone Comparison Returns
Notably, Filippix compared the current setup with SUI’s first major rally. The analyst said SUI is respecting a similar expansion zone to the one that launched its first large move toward the all-time high.
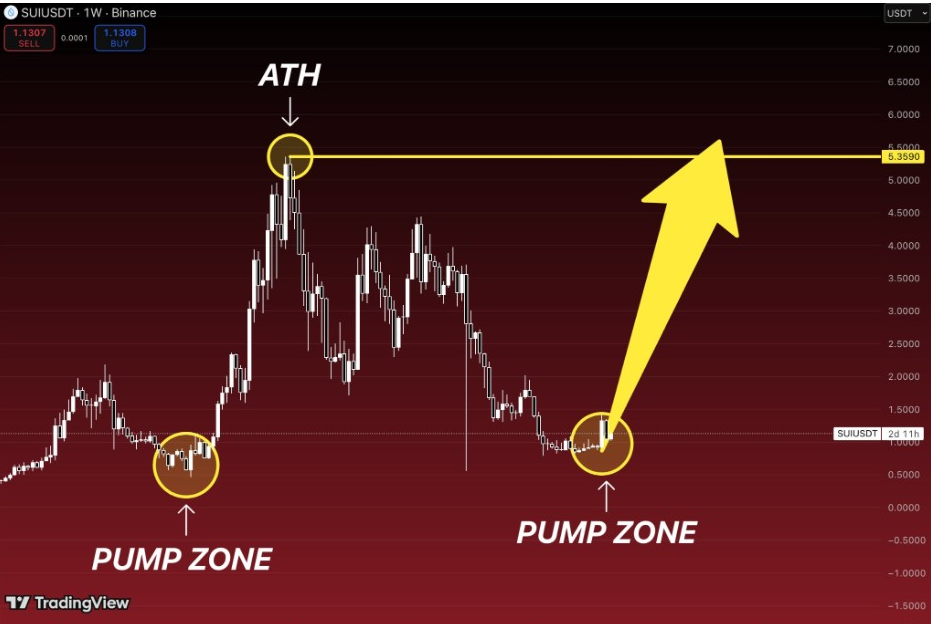
The weekly chart marked the current area as another “pump zone,” similar to the base formed in 2024 before SUI price surged toward its previous high near $5.35. According to the analyst, most traders only turn bullish near highs, while stronger opportunities often appear near overlooked base zones.
This comparison supports the idea that SUI may be forming another accumulation structure. If momentum builds from this range, the path toward the previous all-time high could reopen over time